DATA
In the previous sections of the Sustainability Report, Tecan’s management of material topics is described. The management of material topics generates data that can indicate if a revised approach or new business activities are needed: the data is used in business decisions. For material topics that generate a significant amount of data, such as management of environmental impact and Tecan’s role as an employer, the data related to these topics is shared here.
ENVIRONMENTAL DATA
Tecan calculates greenhouse gas emissions and progress towards our emissions reduction targets annually. 2022 was chosen as the baseline year for reasons of total global footprint data availability and quality. In 2025, Tecan worked to improve data quality related to environmental impact, particularly regarding data associated with purchased materials; these efforts will continue in 2026. Further assessment of suppliers’ environmental impact is also in plan for 2026. Follow up activities to the energy audits Tecan conducted in 2025 are planned, and Tecan has set an energy use reduction target as described in the Climate Impact section of this report. Energy use at Tecan sites is not closely connected to the volume of products produced. Energy consumption, water use and waste data continue to be reported annually.
2025 | 2024 | 2022 | |||
Consumption | GJ | (tCO₂e)1 | (tCO₂e) | (tCO₂e) | |
| Scope 1: Direct energy use per primary source |
|
| 1,945 | 2,010 | 1,730 |
|
|
|
|
| |
| Stationary combustion |
|
| 769 | 762 | 953 |
| Diesel (liters) | 380 | 14 | 1 | 0.40 | 0.89 |
| Natural gas (KWh) | 3,260,102 | 11,736 | 661 | 613 | 824 |
| Propane (liters) | 64,914 | 1,655 | 107 | 147 | 128 |
| Petrol (liters) | 240 | 8 | 1 | 1 | 671 |
| Mobile combustion |
|
| 1,042 | 1,136 | 300 |
| Diesel (liters) | 152,683 | 5,456 | 393 | 529 | 371 |
| Petrol (liters) | 200,248 | 6,633 | 414 | 407 | - |
| LPG (liters) |
|
|
| – | - |
| Hybrid Diesel (liters) | 8,961 | 320 | 23 | 14 | - |
| Hybrid Petrol (liters) | 102,354 | 3,390 | 212 | 185 | - |
| Fugitive Emissions: Refrigerants (kg) | 69 |
| 134 | 112 | 106 |
|
|
|
|
| |
| Scope 2: Indirect energy use per primary source (market based) |
|
| 102 | 1,031 | 6,574 |
|
|
|
|
| |
| Electricity (KWh) |
|
|
|
|
|
| Grid (KWh) | – | - | - | 913 | 6,482 |
| Renewable (KWh) | 17,062,758 | 61,426 | - | – | - |
| Electric vehicles (KWh) | 133,215 | 480 | - | 38 | - |
| District cooling (KWh) | - | - | - | 0.05 | - |
| District heating (KWh) | 788,853 | 2,840 | 102 | 80 | 93 |
| Energy (GJ) total |
| 93,958 |
|
|
|
| Emission intensity (scope 1 + 2 emissions in tCO₂e/turnover in CHF million) |
|
| 2.32 | 3.25 | 7.26 |
|
|
|
|
| |
| Total Scope 1+2 (tCO₂e) |
|
| 2,047 | 3,041 | 8,305 |
|
|
|
|
| |
| Scope 3: Other indirect emissions |
|
| 389,343 | 439,268 | 474,048 |
|
|
|
|
| |
| Total Scope 1+2+3 (tCO₂e) |
|
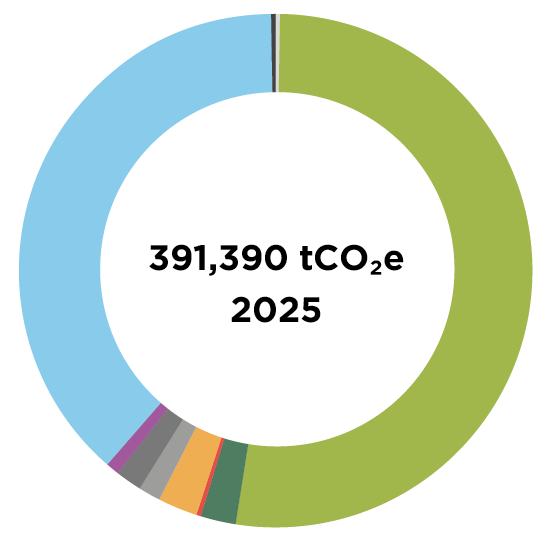
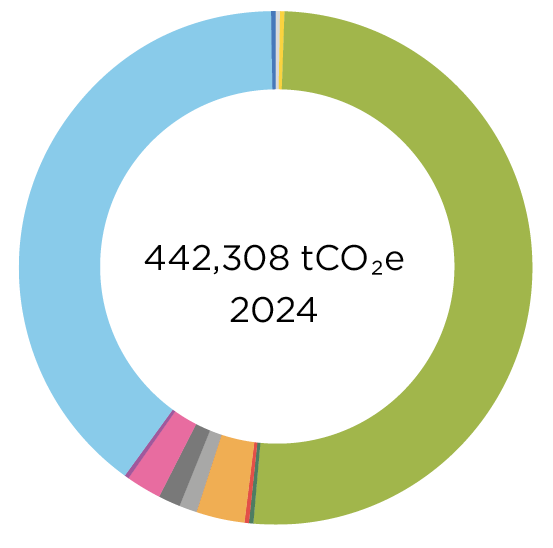
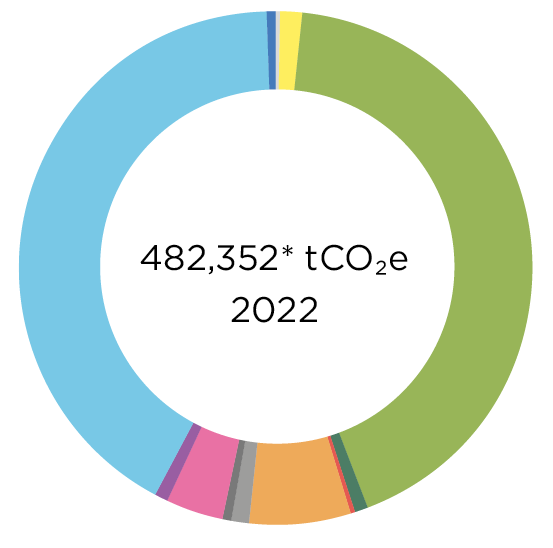
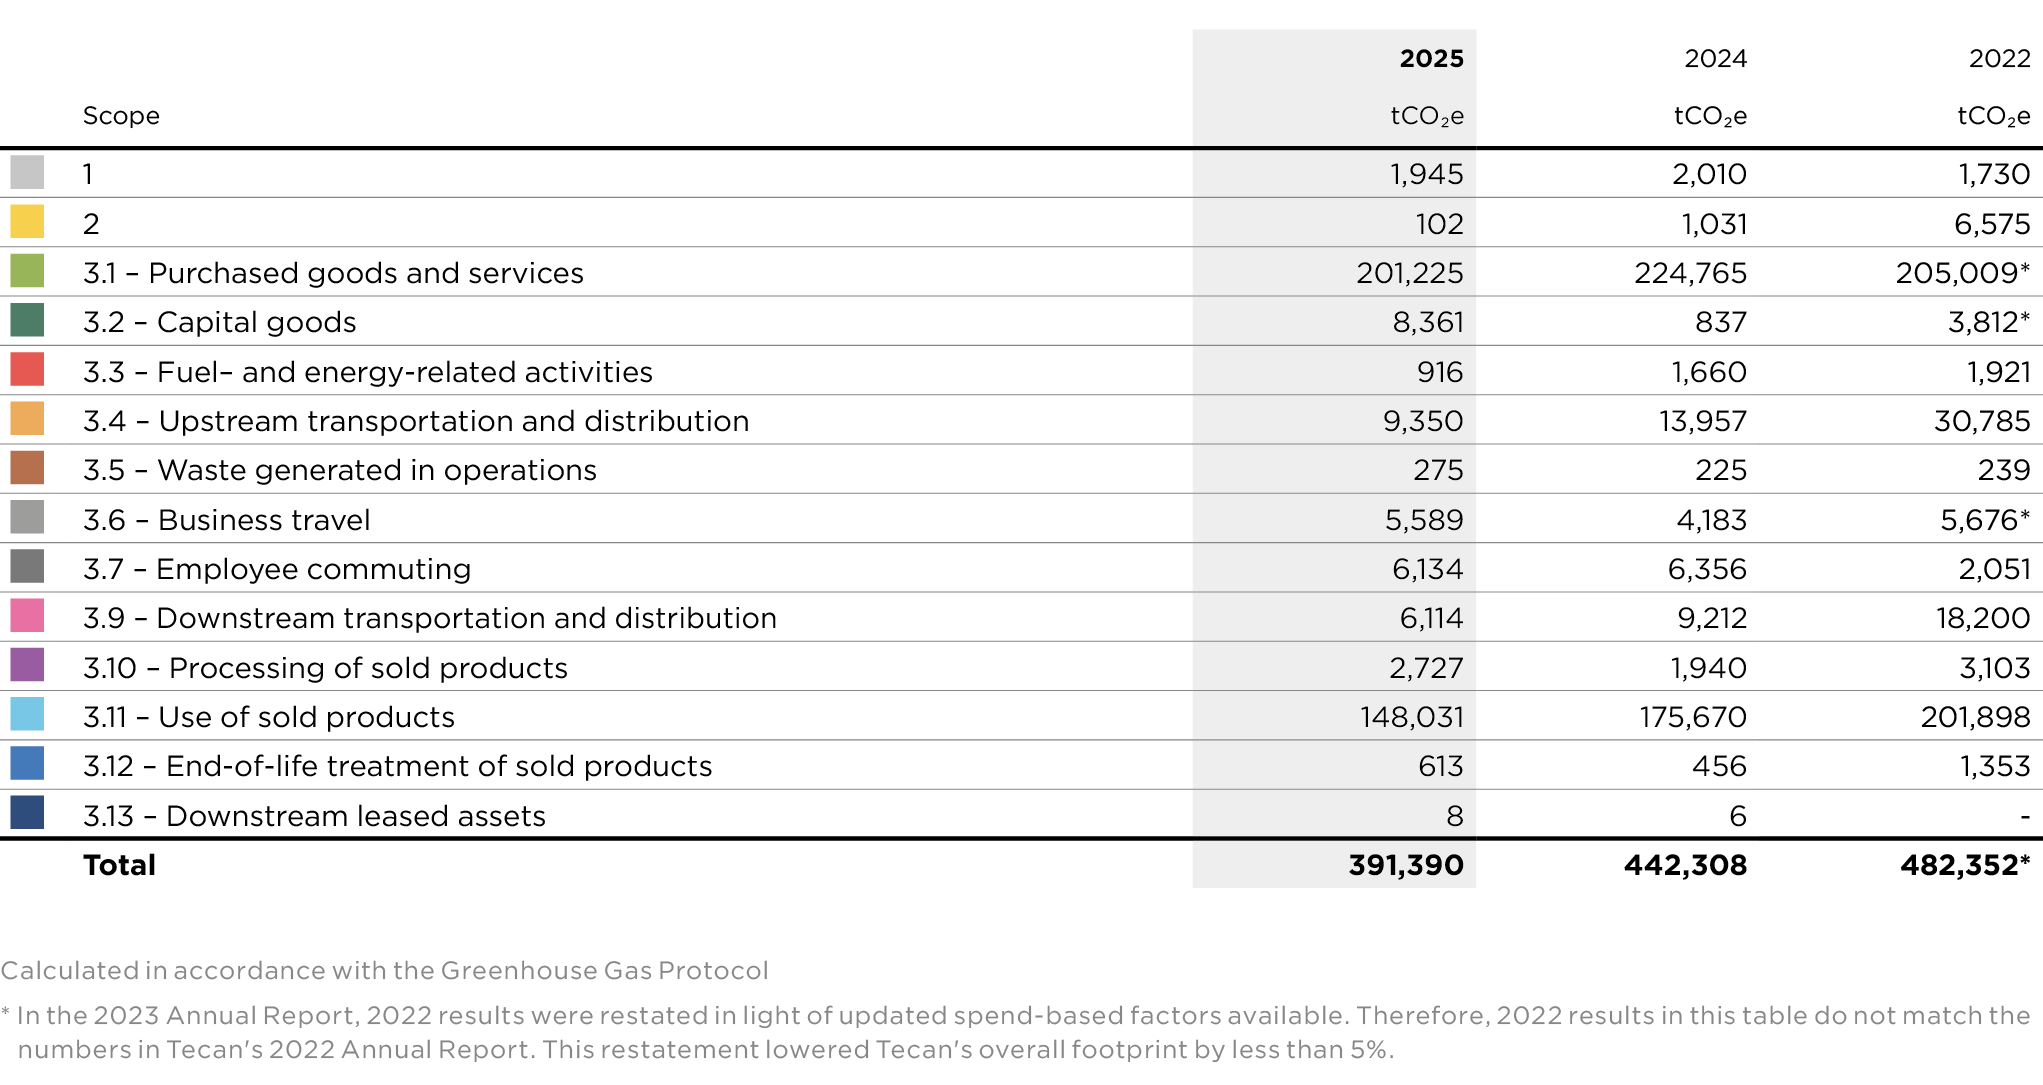
| 391,390 | 442,308 | 482,352 |
- Emissions are calculated in accordance with the Greenhouse Gas Protocol and represented in tCO2e (tonnes carbon dioxide equivalent).
Tecan’s total greenhouse gas emissions decreased by 12% in 2025 compared to 2024, and by 19% compared to our 2022 baseline. Purchasing 100% renewable electricity accounted for some of this decrease, and we are committed to continuing to source renewable electricity, as well as pursue other renewable energy options where possible. As previously, a decrease in emissions associated with logistics can be attributed to increasingly localized production and lower emissions transport. Sales volume has a slight impact on the reduction in emissions attributable to "use of sold products", as does a more favorable grid energy mix. Our lower "purchased goods and services" emissions result from better data – we were able to calculate emissions based on weight of materials rather than estimate based on spend. This improved data availability is a prerequisite to pursuing emissions reduction through supplier engagement and purchasing choices, which is a key pathway for achievement of our science based emissions reduction targets.
In 2026, Tecan will continue to pursue the emissions reduction and environmental management activities described in the Climate Impact section of this report. Emissions are calculated in accordance with the Greenhouse Gas Protocol and represented in tCO₂e. There are no biogenic CO₂ emissions. GWP (global warming potential) used is from the IPCC Report 2024 AR6 whenever possible, emissions factors used are mainly DEFRA BEIS 2024, IEA 2024, Ecoinvent V3.11 and CEDA 2025. The scope 2 data in the table above is market-based. The emissions consolidation approach used is operational control. Calculations are based on activity so far as possible and otherwise on spend data. Spend data was either converted into activity data through estimations or directly calculated through spend-based emission factors. Any data gaps were filled through extrapolations based on averages per either number of full-time employees or square meters surface.
LOCATION-BASED APPROACH
| Scope | GHG Category | 2025 (tCO₂e) | 2024 (tCO₂e) | 2022 (tCO₂e) |
| Scope 2 | 6,795 | 7,908 | 7,178.12 | |
| Scope 2 | Electricity: Grid | 0 | 908 | 6,019.33 |
| Scope 2 | Electricity: Renewable | 6,669 | 6,888 | 1,065.39 |
| Scope 2 | Electricity: Electric vehicles | 24 | 33 | - |
| Scope 2 | Cooling | 1 | 0.05 | - |
| Scope 2 | Heating | 102 | 80 | 93.40 |
| Scope 3 |
|
|
| |
| Scope 3 | Fuel- and energy-related activities | 2,314 | 2,061 | 5,148.73 |
WATER AND WASTE DATA
2025 | 2024 | 2022 | ||||
Amount | (tCO₂e) | Amount | (tCO₂e) | Amount | (tCO₂e) | |
| Waste generated in operations (tons) | ||||||
| Incineration | 87 | 25 | 94 | 36 | 103.09 | 54 |
| Incineration hazardous | 8 | 20 | 19 | 47 | 8.82 | 22 |
| Landfill | 384 | 200 | 213 | 111 | 263.08 | 120 |
| Landfill hazardous | 0.01 | 0 | 0 | 0 | 16.33 | 3 |
| Recycling | 302 | 1 | 583 | 4 | 289.25 | 6 |
| Unspecified | 14 | 7 | 8 | 4 | 18.81 | 9 |
| Unspecified hazardous | 4 | 11 | 4 | 11 | 2.43 | 6 |
| Radioactive treatment | 0.40 | 0 | 0.35 | 0.09 | 0.29 | - |
| Composting | 3.30 | 0 | 9 | 0.08 | - | - |
| Wastewater (m3) | 59,342 | 10 | 68,632 | 13 | 70,725.41 | 19 |
Waste is monitored and managed locally and waste data is collected from local site managers by Tecan’s Global Head of EHS (Environment, Health and Safety).
TOTAL TCO₂E
SOCIAL IMPACT DATA
EMPLOYEE DATA
This data is headcount data unless indicated otherwise and reflects the period January 1, 2025 – December 31, 2025. Employees may have permanent or temporary contracts. Unless otherwise indicated, the data refers to all Tecan employees. Certain Tecan employee benefits programs are specific to countries and/or influenced by local law. Tecan’s benefits always meet and may exceed legal requirements. Examples of benefits include life insurance, health care, disability and invalidity coverage, parental leave, other paid leave, retirement provision, stock ownership, global travel insurance, commuting subsidies, and company cars. Offer and acceptance of benefits is tracked internally but not reported, for reasons of business confidentiality. Analysis regarding the ratio of basic salary and remuneration of women to men is also carried out per country and reported where completed.
GENDER DIVERSITY (# AND %) OF ALL EMPLOYEES GLOBALLY, AND BY REGION
Region of operations | No. of female employees | Female | No. of male employees | Male | No. of not disclosed gender | Not disclosed gender em- | No. of all employees | All |
Asia Pacific | 716 | 21.66% | 435 | 13.16% | 3 | 0.09% | 1,154 | 34.92% |
North America | 304 | 9.20% | 483 | 14.61% | 4 | 0.12% | 791 | 23.93% |
Other Europe | 235 | 7.11% | 406 | 12.28% |
|
| 641 | 19.39% |
Switzerland | 217 | 6.57% | 502 | 15.19% |
|
| 719 | 21.75% |
Total global operations | 1,472 | 44.54% | 1,826 | 55.25% | 7 | 0.21% | 3,305 | 100.00% |
GENDER DIVERSITY (# AND %) OF ALL EMPLOYEES GLOBALLY BY CONTRACT TYPE
| Contract type | No. of female employees | Female | No. of male employees | Male | No. of not disclosed gender | Not disclosed gender em- | No. of all employees | All employees (%) |
| Permanent employee | 1,443 | 43.66% | 1,787 | 54.07% | 7 | 0.21% | 3,237 | 97.94% |
| Temporary employee | 29 | 0.88% | 39 | 1.18% |
|
| 68 | 2.06% |
| Full-time employee | 1,312 | 39.70% | 1,707 | 51.65% | 7 | 0.21% | 3,026 | 91.56% |
| Part-time employee | 160 | 4.84% | 119 | 3.60% |
|
| 279 | 8.44% |
Non-guaranteed hours employees (casual workers, on-call employees, zero-hours contracts) | 0 | 0% | 0 | 0% | 0 | 0% | 0 | 0% |
NUMBER AND % OF EMPLOYEE CONTRACT TYPES BY REGION
| Contract type FTE | No. of | % of | No. of | % of | No. of | % of | No. of | % of |
| Permanent employees | 1,133 | 98.18% | 791 | 100.00% | 615 | 95.94% | 698 | 97.08% |
| Temporary employees | 21 | 1.82% |
|
| 26 | 4.06% | 21 | 2.92% |
| Full-time employees | 1,150 | 99.65% | 787 | 99.49% | 544 | 84.87% | 545 | 75.80% |
| Part-time employees | 4 | 0.35% | 4 | 0.51% | 97 | 15.13% | 174 | 24.20% |
| Non-guaranteed hours employees (casual workers, on-call employees, zero-hours contracts) | 0 | 0% | 0 | 0% | 0 | 0% | 0 | 0% |
All employee data for Tecan entities worldwide is now centrally maintained within Employee Central, part of the SuccessFactors suite. This unified platform enables direct querying and ensures consistency across all locations. With the full global rollout completed, Employee Central serves as the single source of truth for HR data.
NUMBER OF NON-EMPLOYEES BY CONTRACT TYPE AND PERCENTAGE SHARE OF TOTAL WORKFORCE
| Contract type Headcount | No. of workers on each | Percentage (%) of workers within total |
| External Contractor | 73 | 1.79% |
| External Temporary | 13 | 0.32% |
| Third Party Contracts | 692 | 16.95% |
| Board of Directors | 7 | 0.17% |
| Total number of employees in global operations | 3,305 | 80.95% |
| Total workforce (employee + non-employee workers) | 4,083 | 100.00% |
Non-employees are individuals who work for Tecan but are not regular employees. This group includes third party vendors (including individuals with occasional IT access and minimal activity), temporary workers hired through agencies, and Board Members. Tecan hires these workers either indirectly, through agencies or third party vendors, or directly as contractors. These non-employees help support Tecan’s everyday business activities, even though they are not officially employed by the company.
GENDER DIVERSITY (%) OF THE COMPANY’S GOVERNANCE BODIES (MANAGEMENT BOARD AND BOARD OF DIRECTORS)

AGE DIVERSITY (%) OF THE COMPANY’S GOVERNANCE BODIES (MANAGEMENT BOARD AND BOARD OF DIRECTORS)

NEW EMPLOYEE HIRES ACROSS GLOBAL COMPANY, HIRE RATE (%) AND BY GENDER
2025 | 2024 | 2023 | ||||
| Gender group | New hires across global operations | New hire rate (%) | New hires across global operations | New hire rate (%) | New hires across global operations | New hire rate (%) |
| Female employees | 243 | 7.35% | 152 | 4.55% | 208 | 5.82% |
| Male employees | 203 | 6.14% | 165 | 4.94% | 249 | 6.97% |
| Unknown/Undeclared | 1 | 0.03% | 11 | 0.33% | 10 | 0.28% |
| Total new employees globally | 447 | 13.52% | 328 | 9.82% | 467 | 13.07% |
NEW EMPLOYEE HIRE RATE (%) ACROSS GLOBAL COMPANY BY AGE GROUP
2025 | 2024 | 2023 | ||||
| Age group | New hires across global operations | New hire rate (%) | New hires across global operations | New hire rate (%) | New hires across global operations | New hire rate (%) |
| Employees under 30 years old | 233 | 7.05% | 156 | 4.67% | 175 | 4.90% |
| Employees 30-50 years old | 171 | 5.17% | 134 | 4.01% | 210 | 5.88% |
| Employees over 50 years old | 43 | 1.30% | 38 | 1.14% | 80 | 2.24% |
| Unkown age | - | - | - | - | 2 | 0.06% |
| Total new employees globally | 447 | 13.52% | 328 | 9.82% | 467 | 13.07% |
NEW EMPLOYEE HIRE RATE (%) ACROSS GLOBAL COMPANY BY REGION
2025 | 2024 | 2023 | ||||
| Region of operations | New hires across global operations | New hire rate (%) | New hires across global operations | New hire rate (%) | New hires across global operations | New hire rate (%) |
| Asia Pacific | 235 | 7.11% | 147 | 4.40% | 147 | 4.11% |
| North America | 49 | 1.48% | 66 | 1.98% | 147 | 4.11% |
| Other Europe | 83 | 2.51% | 68 | 2.04% | 93 | 2.60% |
| Switzerland | 80 | 2.42% | 47 | 1.41% | 80 | 2.24% |
| Total new employees globally | 447 | 13.52% | 328 | 9.82% | 467 | 13.07% |
GENDER DIVERSITY (%) OF ALL EMPLOYEES GLOBALLY BY EMPLOYEE CATEGORY
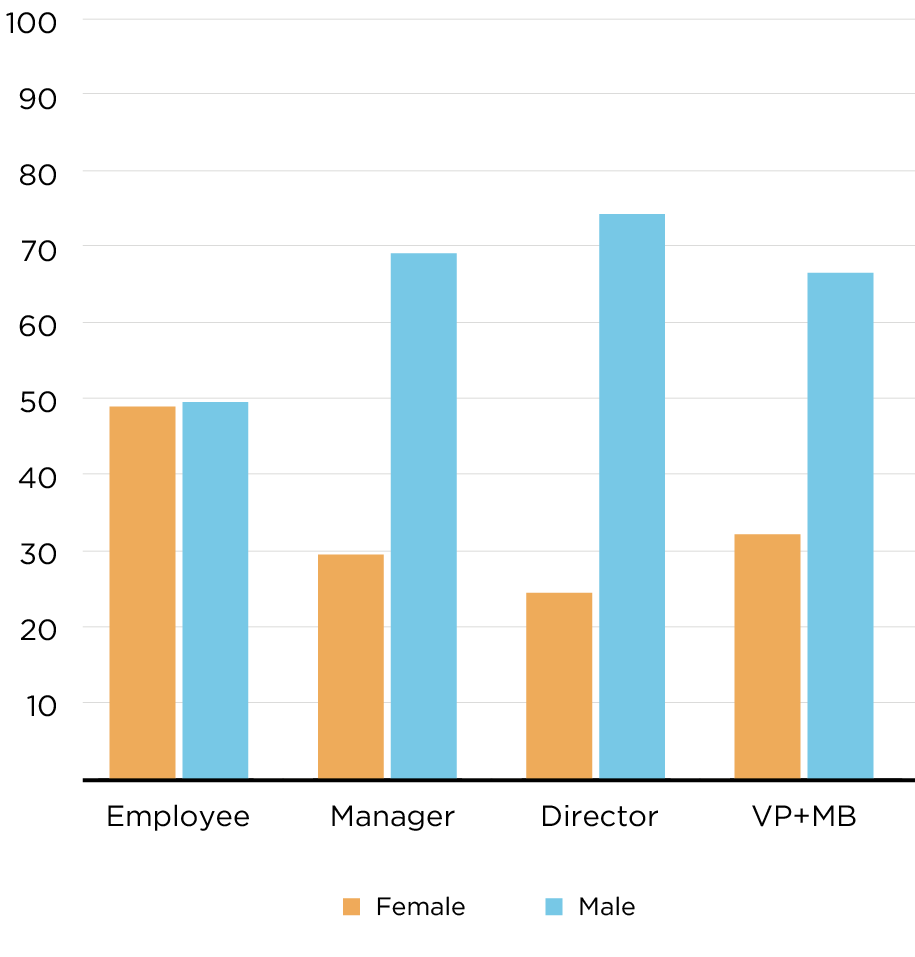
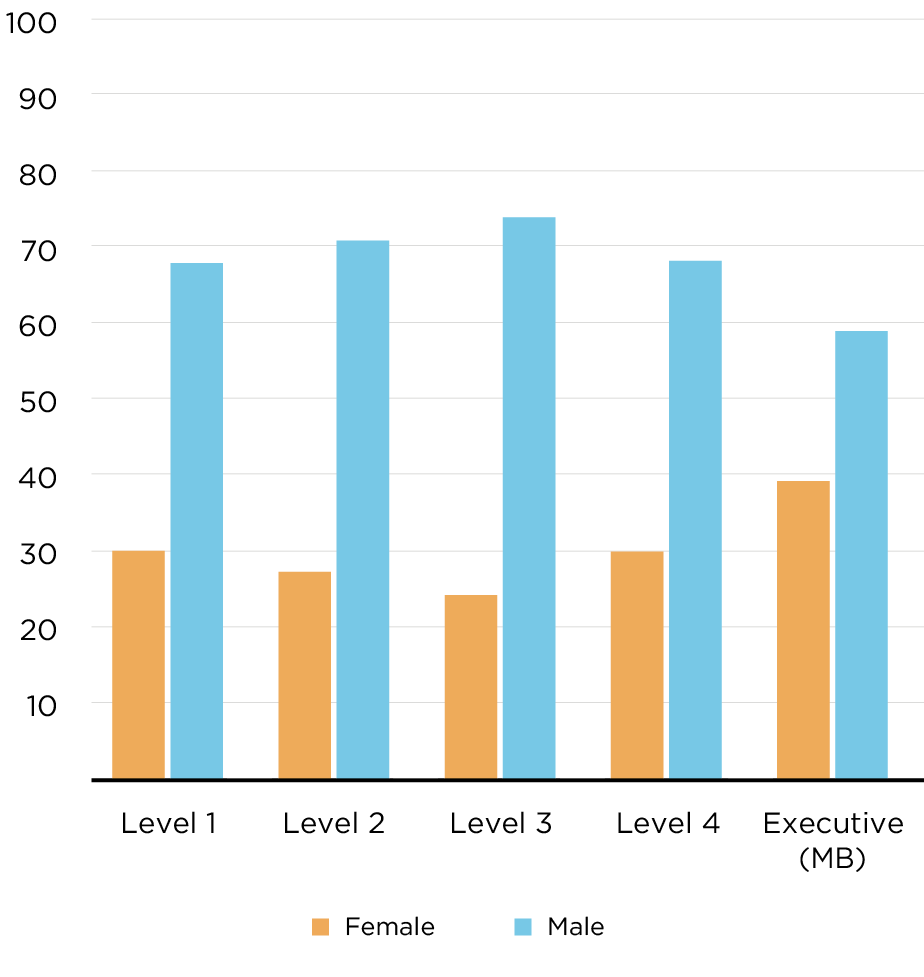
GENDER DIVERSITY (%) OF ALL EMPLOYEES GLOBALLY BY MANAGEMENT LEVEL
AGE DIVERSITY (%) OF ALL EMPLOYEES GLOBALLY BY EMPLOYEE CATEGORY

TURNOVER RATES, VOLUNTARY AND INVOLUNTARY, OF GLOBAL COMPANY, ALSO BY GENDER
| Gender group | No. of voluntary turnover | Voluntary turnover rate (%) | No. of involuntary turnover | Involuntary | No. of all turnover | Total turnover rate (%) |
| Male employees | 133 | 4.02% | 115 | 3.48% | 248 | 7.50% |
| Female employees | 136 | 4.11% | 99 | 3.00% | 235 | 7.11% |
| Unknown | 1 | 0.03% | - | - | 1 | 0.03% |
| Total global employees | 270 | 8.17% | 214 | 6.48% | 484 | 14.64% |
TURNOVER RATES, VOLUNTARY AND INVOLUNTARY, OF GLOBAL COMPANY BY AGE GROUP
| Age group | No. of | Voluntary turnover rate (%) | No. of involuntary turnover | Involuntary | No. of all turnover | Total turnover rate (%) |
| Employees under 30 years old | 87 | 2.63% | 58 | 1.75% | 145 | 4.39% |
| Employees 30-50 years old | 130 | 3.93% | 64 | 1.94% | 194 | 5.87% |
| Employees over 50 years old | 53 | 1.60% | 92 | 2.78% | 145 | 4.39% |
| Total global employees | 270 | 8.17% | 214 | 6.48% | 484 | 14.64% |
TURNOVER RATES, VOLUNTARY AND INVOLUNTARY, OF GLOBAL COMPANY BY REGION
| Region of operations | No. of | Voluntary turnover rate (%) | No. of involuntary turnover | Involuntary turnover rate (%) | No. of all turnover | Total turnover rate (%) |
| Asia Pacific | 133 | 11.53% | 60 | 5.20% | 193 | 16.72% |
| North America | 63 | 7.96% | 98 | 12.39% | 161 | 20.35% |
| Other Europe | 32 | 4.99% | 31 | 4.84% | 63 | 9.83% |
| Switzerland | 42 | 5.84% | 25 | 3.48% | 67 | 9.32% |
| Total global employees | 270 | 8.17% | 214 | 6.48% | 484 | 14.64% |
PERCENTAGE OF ALL EMPLOYEES COVERED BY COLLECTIVE BARGAINING AGREEMENTS
% of employees covered by collective bargaining agreements | |
| Total global operations | 10.62% |
AVERAGE NUMBER OF HOURS OF TRAINING PROVIDED PER EMPLOYEE (FTE BASIS), BY EMPLOYEE CATEGORY
| Employee category | Average hours of training provided per employee |
| Customer service | 70.29 |
| General administration | 15.89 |
| Manufacturing and logistics | 11.11 |
| Research and development | 16.45 |
| Sales and marketing | 17.76 |
| Management | 22.62 |
| Non-management | 29.98 |
For additional information, please refer to the Social Impact section of this report. The Learning and Development section provides details on the types and scope of programs implemented, as well as assistance offered to support employee skill enhancement. In addition, transition assistance programs – designed to facilitate continued employability and support the management of career endings due to retirement or termination – are integrated within our broader learning and development offerings. Line managers are encouraged to engage in at least one annual discussion with each team member regarding their personal development plan. The management of career endings is addressed on a case-by-case basis, considering local legal requirements and individual circumstances.
PERCENTAGE OF ALL EMPLOYEES (EE) WHO RECEIVED A REGULAR PERFORMANCE AND CAREER DEVELOPMENT REVIEW, ALSO BY GENDER
| Gender group | % of employees who received | Number of employees who received | Total number of employees |
| Female employees | 51.70% | 761 | 1.472 |
| Male employees | 76.67% | 1,400 | 1,826 |
| Undeclared/Unknown | 57.14% | 4 | 7 |
| Total global employees | 65.51% | 2,165 | 3,305 |
Tecan’s employee performance review process is offered to all (100%) employees.
HEALTH & SAFETY
Tecan’s Health and Safety program is set out in the Health and Safety section of this report. Below is the data related to the Health and Safety program.
2025 | 2024 | 2023 | |||
| Tecan’s employees covered by Tecan’s occupational health and safety management system, which is described in the Health and Safety section of this report. Workers who are not employees but whose workplace is controlled by Tecan also benefit from this system. (GRI 4053-8ai) | 3,305 (100%) | 3,341 (100%) | 3,573 (100%) | ||
| Employees working at locations where the occupational health and safety management system has been internally audited. At these sites, workers who are not employees but whose workplace is controlled by Tecan also benefit from this. (GRI 403-8aii) | 2,385 (72%) | 1,234 (37%) | 717 (20.1%) | ||
Globally, Tecan has 562 workers who are not employees. For 2025, Tecan does report which locations these workers are based at, and so does report what % of these workers are at sites where the occupational health and safety management system has been internally audited. (GRI 403-8b) | 728 (94%) | 480 (85%) | Not reported | ||
| GRI 403-9ai – 9bv follow: |
|
|
| ||
| For all employees: The number and rate of fatalities as a result of work-related injury | 0 | 0 | 0 | ||
| For all employees: The number and rate of high-consequence work-related injuries (excluding fatalities) | 0 | 0 | 0 | ||
| For all employees: The number and rate of recordable work-related injuries (Average TRIR* 2023-2025: 4.06) | 22, 3.61 (LTIR 1.48) | 34, 5.511 (LTIR 3.55) | 20, 3.04 (LTIR 1.83) | ||
| For all employees: The main types of work-related injury | Contusion, cut and puncture | Contusion, cut and puncture | Cut, back pain | ||
| For all employees: The number of hours worked | 6,090,764 | 5,064,238 | 6,568,675 | ||
| For all workers who are not employees but whose work and/or workplace is controlled by the organization: The number and rate of fatalities as a result of work-related injury | 0, 0 | 0, 0 | 0, 0 | ||
| For all workers who are not employees but whose work and/or workplace is controlled by the organization: The number and rate of high-consequence work-related injuries (excluding fatalities) | 0, 0 | 0, 0 | 0, 0 | ||
| For all workers who are not employees but whose work and/or workplace is controlled by the organization: The number and rate of recordable work-related injuries | 0, 0 | 0, 0 | 0, 0 | ||
| For all workers who are not employees but whose work and/or workplace is controlled by the organization: The main types of work-related injury | No injuries reported | No injuries reported | No injuries reported | ||
| For all workers who are not employees but whose work and/or workplace is controlled by the organization: The number of hours worked | This data is not | This data is not | This data is not available for 2023 | ||
| Rates have been calculated based on 1,000,000 hours worked (GRI 403-9e) |
|
|
| ||
| No workers have been excluded from this disclosure. (GRI 403-9f) |
|
|
| ||
| GRI 403-10ai – 10bi follow: |
|
|
| ||
| For all employees: The number of fatalities as a result of work-related ill health | 0 | 0 | 0 | ||
| For all employees: The number of cases of recordable work-related ill health | 3 | 3 | 1 | ||
| For all employees: The main types of work-related ill health | No ill health reported | Musculoskeletal | Musculoskeletal disorder | ||
| For all workers who are not employees but whose work and/or workplace is controlled by the organization: The number of fatalities as a result of work-related ill health | 0 | 0 | 0 | ||
| For all workers who are not employees but whose work and/or workplace is controlled by the organization: The number of cases of recordable work-related ill health | 0 | 0 | 0 | ||
| For all workers who are not employees but whose work and/or workplace is controlled by the organization: The main types of work-related ill health | No ill health reported | No ill health reported | No ill health reported | ||
| GRI 403-10ci – 10d follow: |
|
|
| ||
| The work-related hazards that pose a risk of ill health, including how these hazards have been determined: Insufficient ergonomics or inadequate workplace design was identified and recorded as a risk through the Group-wide risk assessment. Mitigation of the risk is being achieved by ensuring proper infrastructure is in place. In the reporting year, one case of ill health has been attributed to this work-related hazard. No workers are excluded from this disclosure. |
|
|
| ||
Due to a technical error, in 2024 the "rate of recordable work-related injuries" was reported as 6.71; the correct rate is 5.51. The error resulted from the total sum of effective hours worked not containing the working hours of Switzerland.
*TRIR – Total recordable incident rate; LTIR – Lost time incident rate
GOVERNANCE DATA
PRODUCT QUALITY AND SAFETY
Tecan’s Quality and Regulatory Affairs teams follow long-established and strictly controlled internal processes, as described in the Product Quality and Safety section of this report. Key data points are reported below.
| Description | Unit | 2025 | 2024 | 2023 |
| Patient Safety and Product Quality |
|
|
|
|
| QMS Certified Sites (ISO 9001, ISO 13485, or MDSAP) | % | 86 | 86 | 86 |
| Number of Good Manufacturing Practices Health Authority/Regulatory Inspections* | # | 3 | 3 | 8 |
| Number of Health Authority Recalls | # | 1 | 1 | 1 |
| Quality Audits of Tecan Sites | % | 100 | 86 | 86 |
*The Good Manufacturing Practices Health Authority/Regulatory Inspections were all passed with no observations.
The recall did not reveal any repeating issues; in 2025 the grounds were a software issue related to Fluent Control V3.7. As in previous years, in 2025 Tecan did not receive any FDA warning letters or Consent Degrees.
RESPONSIBLE SOURCING
Tecan’s Responsible Sourcing program tracks the results of program activities at every step of the process set out in the Responsible Sourcing section of this report. The metrics shown below in bold are included in the data shared in this report:
Percentage and/or number of suppliers annually that:
- Have their sustainability performance assessed during the supplier qualification process
- Sign Tecan’s Supplier Code of Conduct
- Complete an EcoVadis assessment
- Implement a corrective action plan
- Were inspected or visited
- Were further assessed via Tecan’s responsible sourcing escalation process
- Tecan terminates a relationship with because of their poor sustainability practices
In 2025, all new suppliers were screened as described in the Responsible Sourcing section of this report. Screening is carried out simultaneously for impacts relating to Environment, Labor and Human Rights, Ethics, and Sustainable Procurement. Suppliers representing 85% of production-related spend for Tecan's main production sites have now committed to the standards set out in our Supplier Code of Conduct. In addition, 81% of such suppliers have had their ESG performance further assessed. We are in the process of implementing improvement action plans with selected suppliers. In 2025, no (0) suppliers had completed a corrective action plan. One (1) supplier relationship was terminated because of poor supplier sustainability practices.
| 2025 Responsible Sourcing program data | ||
| Percentage of new suppliers that were screened using environmental criteria | 100% (79) new suppliers were screened in 2025. | |
| Number of suppliers assessed for environmental impacts | 2,677 suppliers screened on EcoVadis IQ platform for environmental impacts. As of 2025, 776 suppliers have been further assessed on sustainability performance, including practices to manage environmental impacts. | |
| Number of suppliers identified as having significant actual and potential negative environmental impacts | 10 suppliers were identified as having significant potential negative environmental impacts, showing performance gaps during supplier assessment. | |
| Significant actual and potential negative environmental impacts identified in the supply chain | Top 3 environmental potential risks in our supply chain identified via EcoVadis IQ risk screening: 1) Energy consumption & GHGs, 2) Materials, Chemicals & Waste, and 3) Water | |
| Percentage of suppliers identified as having significant actual and potential negative environmental impacts with which improvements were agreed upon as a result of assessment | 100% of the 10 suppliers have signed Tecan's Supplier Code of Conduct. These suppliers are currently being further assessed and corrective action plans will be implemented where required, as described in the Responsible Sourcing section of this report. | |
| Percentage of suppliers identified as having significant actual and potential negative environmental impacts with which relationships were terminated as a result of assessment, and why | 0 | |
| Operations and suppliers considered to have significant risk for incidents of: child labor | 90 suppliers presented potentially high labor and human rights risk in EcoVadis risk screening. Of these, 4 suppliers were identified as having significant risk for labor and human rights incidents, showing performance gaps during supplier assessment. | |
| Operations and suppliers considered to have significant risk for incidents of: young workers exposed to hazardous work | Significant risk for labor and human rights incidents does not differentiate between/is inclusive of child labor, forced labor and the risk of young workers exposed to hazardous work. | |
| Operations and suppliers considered to have significant risk for incidents of child labor either in terms of: type of operation (such as manufacturing plant) and supplier | 50 of the 90 suppliers presented potentially high risk for labor and human rights in terms of industry, based on EcoVadis IQ screening. | |
| Operations and suppliers considered to have significant risk for incidents of child labor either in terms of: countries or geographic areas with operations and suppliers considered at risk | 71 of the 90 suppliers presented potentially high risk for labor and human rights in terms of countries at risk, based on EcoVadis IQ screening. | |
| Measures taken by the organization in the reporting period intended to contribute to the effective abolition of child labor | 92% of the 90 suppliers presenting potentially high labor and human rights risk have now signed Tecan's Supplier Code of Conduct as an early step in the Responsible Sourcing process. The 4 suppliers presenting significant risk have all committed to Tecan's Supplier Code of Conduct and are now within the Supplier Evaluation step of the process, amongst other suppliers. These suppliers will undergo further assessment and corrective action plans will be implemented where required, as described in the Responsible Sourcing section of this report. | |
| Operations and suppliers considered to have significant risk for incidents of forced or compulsory labor either in terms of: type of operation (such as manufacturing plant) and supplier | Significant risk for labor and human rights incidents does not differentiate between child labor, forced labor and the risk of young workers exposed to hazardous work. | |
| Operations and suppliers considered to have significant risk for incidents of forced or compulsory labor either in terms of: countries or geographic areas with operations and suppliers considered at risk | Significant risk for labor and human rights incidents does not differentiate between child labor, forced labor and the risk of young workers exposed to hazardous work. | |
| Measures taken by the organization in the reporting period intended to contribute to the elimination of all forms of forced or compulsory labor | As per above ("Measures taken by the organization in the reporting period intended to contribute to the effective abolition of child labor") |