

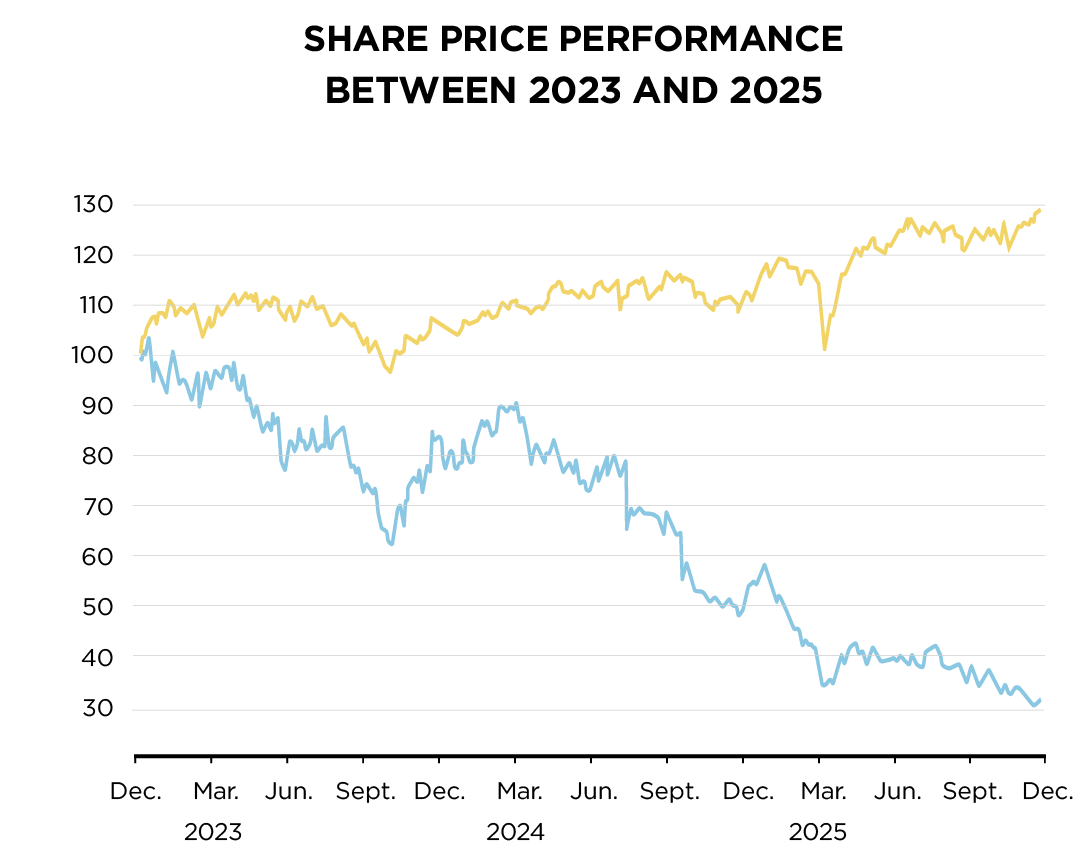
In 2025, the Tecan share declined by 36.6%, closing the year at CHF 128.50. The year was challenging for the life sciences industry overall, which continued to face uncertainty on multiple fronts. Ongoing policy noise, including NIH funding uncertainties in the US and potential tariffs for pharmaceutical companies, contributed to more restrictive CAPEX investments in instruments. In addition, persistent market weakness in China weighed on sector performance. As a result, the life science tools sector underperformed the broader market for the fourth consecutive year.
In contrast to the negative sector trend globally, 2025 was a positive year for Swiss equities overall. Thanks to a year-end rally and strong performance from several index heavyweights, the SPI Extra gained 16.9%.
SHARE INFORMATION
| Listing: | SIX Swiss Exchange |
| Stock name: | Tecan Group |
| Security number: | 1210019 |
| ISIN: | CH0012100191 |
| Bloomberg: | TECN SW |
| Reuters: | TECN.S |

TECAN SHARE
2023 | 2024 | 2025 | |
| Numbers of shares issued | 12,783,087 | 12,825,883 | 12,825,883 |
| Number of treasury shares | - | 100,000 | 291,913 |
| Number of shares outstanding at December 31 | 12,783,087 | 12,725,883 | 12,533,970 |
| Average number of shares outstanding | 12,770,050 | 12,766,549 | 12,662,178 |
| Share price at December 31 (CHF) | 383.40 | 202.60 | 128.50 |
| High (CHF) | 428.00 | 373.80 | 241.40 |
| Low (CHF) | 256.40 | 197.50 | 123.70 |
| Average number of traded shares per day1 | 32,253 | 35,742 | 52,897 |
| Average trading volume per day (CHF)1 | 11,310,160 | 10,687,930 | 8,792,539 |
INFORMATION PER SHARE
2023 | 2024 | 2025 | |
| Basic earnings per share (CHF/share) | 10.34 | 5.3 | -8.74 |
| Adjusted earnings per share (CHF/share) | 12.88 | 8.08 | 6.87 |
| Shareholders’ equity at December 31 (CHF 1,000) | 1,348,910 | 1,453,331 | 1,151,491 |
| Dividend (CHF) | 3.00 | 3.00 | 3.002 |
| Dividend yield (%)3 | 0.87% | 1.48% | 2.33% |
FINANCIAL RATIOS
2023 | 2024 | 2025 | |
| Market capitalization (CHF million)4 | 4,389.7 | 2,578.3 | 1,610.6 |
| Price Earnings Ratio5 | 26.66 | 25.07 | 18.70 |
- Including off-exchange trading.
- Proposal to the Annual General Meeting of Shareholders on April 15, 2026.
- At share price as of Dec. 31.
- Number of shares outstanding at Dec. 31 multiplied with share price as of Dec. 31.
- Share price as of Dec. 31 divided by adjusted earnings per share.