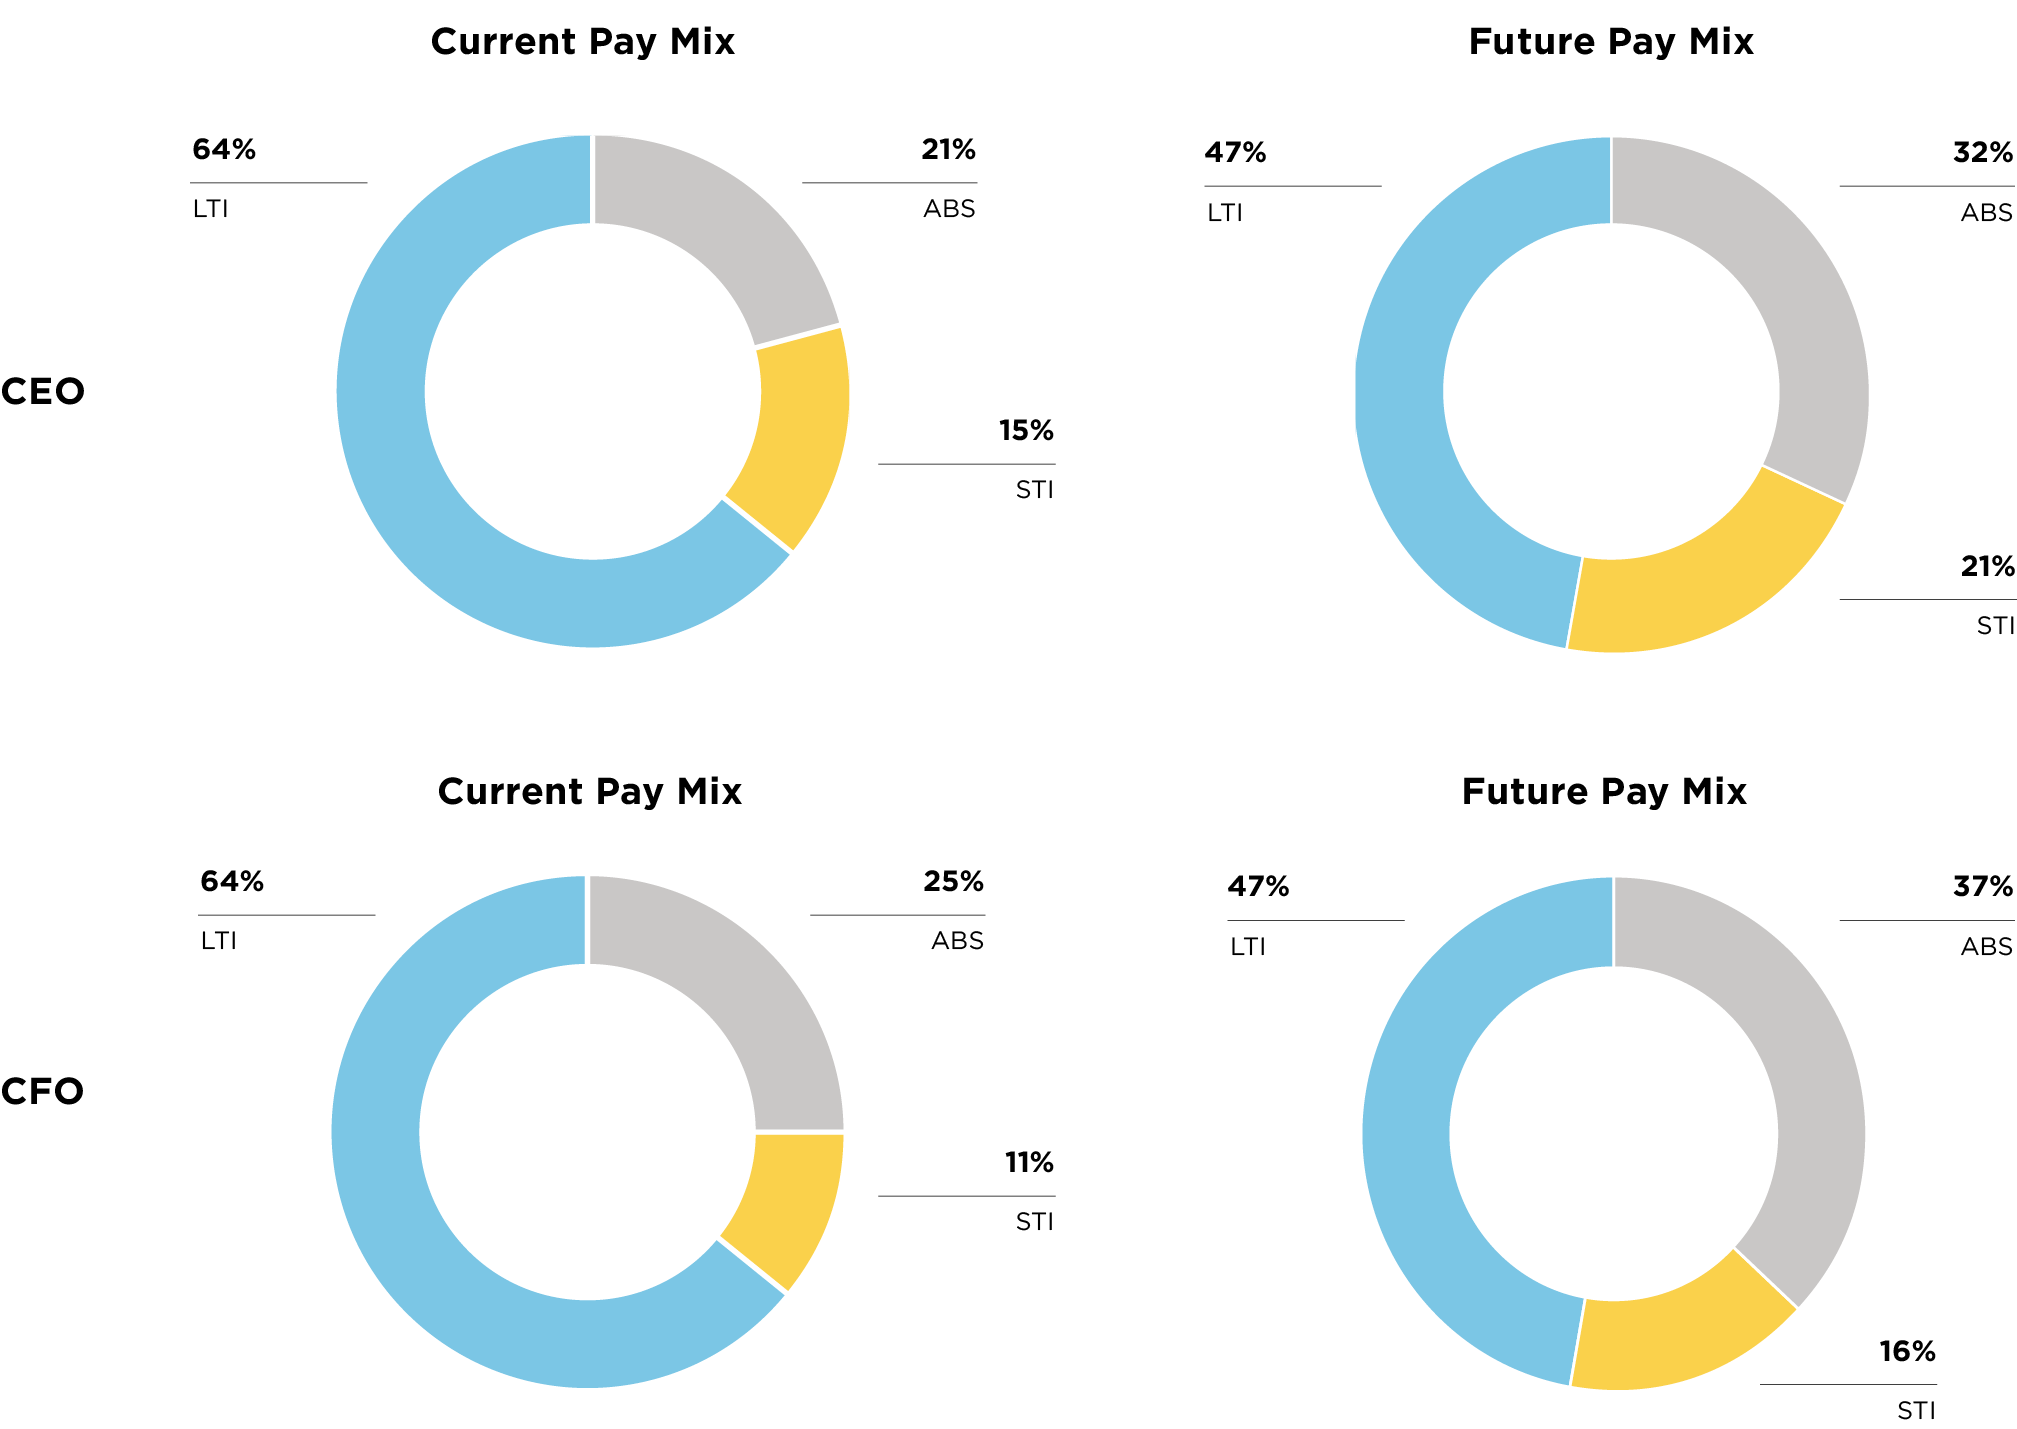
The figure below shows how the proportions of the compensation mix at target are changed for the CEO and CFO from 2025 to 2026 going forward.
OVERVIEW OF THE NEW COMPENSATION SYSTEM FOR THE MANAGEMENT BOARD (EFFECTIVE JANUARY 2026)
STRATEGIC CONTEXT
Over the past decade, Tecan has demonstrated a strong track record of financial performance, consistently achieving sales growth that outpaced underlying market averages. This success was driven by a combination of organic initiatives and targeted mergers and acquisitions, which allowed the company to expand its market presence and capabilities. The Company’s adjusted EBITDA also grew in line with sales, reflecting the benefits of increased scale, disciplined cost management, and operational efficiency.
However, in recent years, Tecan has faced a more challenging market environment, resulting in a substantial decline in both sales and profits. These headwinds have underscored the need for a compensation system that not only rewards past performance but also incentivizes a return to sustainable, profitable growth and the creation of long-term shareholder value. The revised compensation system for the Management Board, effective January 2026, is designed with these objectives in mind.
SHAREHOLDER FEEDBACK AND COMPENSATION COMMITTEE ACTIONS
The 2025 Annual General Meeting highlighted significant shareholder concerns, reflected in the Compensation Report receiving an approval rate of less than 50%. Key concerns raised by shareholders and proxy advisors included a minimum guaranteed vesting of restricted shares under the LTI (Long-Term Incentive), insufficient differentiation between STI and LTI performance indicators and incomplete disclosure of the STI (Short-Term Incentive) and LTI target achievement. Shareholders expressed a desire for a clearer link between compensation and performance, and for greater transparency in how targets are defined and achieved.
This feedback was taken seriously by the Compensation Committee, which is responsible for overseeing executive compensation and ensuring alignment with Tecan’s strategic goals. The Compensation Committee, comprising Myra Eskes (Chair), Dr. Christa Kreuzburg, and Dr. Daniel R. Marshak, undertook a thorough review of the compensation system of the Management Board. The committee’s activities included benchmarking against relevant market practice and aligning compensation with the company strategy.
KEY CHANGES TO THE COMPENSATION STRUCTURE AND DISCLOSURE
1. TRANSITION FROM PSMP TO PSUP
One of the most significant changes is the transition from the PSMP (Performance Share Matching Plan), which included an initial allocation of restricted shares, to the fully performance-based PSUP (Performance Share Unit Point. Under the previous system, a portion of the LTI was not based on additional performance criteria other than the share price development, which was no longer acceptable to shareholders and did not align with market practice among Swiss listed companies. The new PSUP structure eliminates guaranteed vesting, ensuring that all variable compensation is truly performance-based and at risk.
2. COMPENSATION MIX AND BENCHMARKING
In the context of the replacement of the PSMP with the PSUP, the compensation mix of the Management Board members was revised to account for the shift to a fully performance-based LTI. The previously guaranteed restricted shares of the previous PSMP have been allocated to the different components of the newly revised compensation mix. While the LTI remains the largest compensation component, the new structure increases the proportion of cash compensation (Annual Base Salary [ABS] and STI), ensuring that the total cash compensation remains at or below the median benchmark of Tecan’s peer group. This reallocation also considers that the annual benchmarking showed year after year that the ABS was below the 25th percentile of the peer group (details on benchmarking and the related peer group can be found in the Compensation Report 2025). The revised compensation mix brings Tecan closer to market practice, with a more balanced distribution between ABS, STI, and LTI while total target compensation remains unchanged.
3. ENHANCED PERFORMANCE INDICATOR STRUCTURE
There has been critical feedback about the overlap in STI and LTI performance indicators, which we acknowledge. The KPI framework has been adjusted to define a matrix which drives both business unit and overall company performance and best reflects our business strategy. Therefore, we decided that starting in 2026, we will include additional business- unit specific revenue and profitability targets to the STI. We are also introducing a relative Total Shareholder Return (rTSR) target in the LTI with the highest weighting. By doing so, the LTI now includes a relative and external performance view, ensuring that the Management Board’s interests are closely aligned with those of our shareholders. The adjusted EBITDA percentage improvement and improvement in revenue have been retained in the LTI with a three-year horizon, as we strongly believe these are the right performance indicators to bring Tecan back to sustainable growth and the right level of profitability.
SHORT-TERM INCENTIVE (STI)
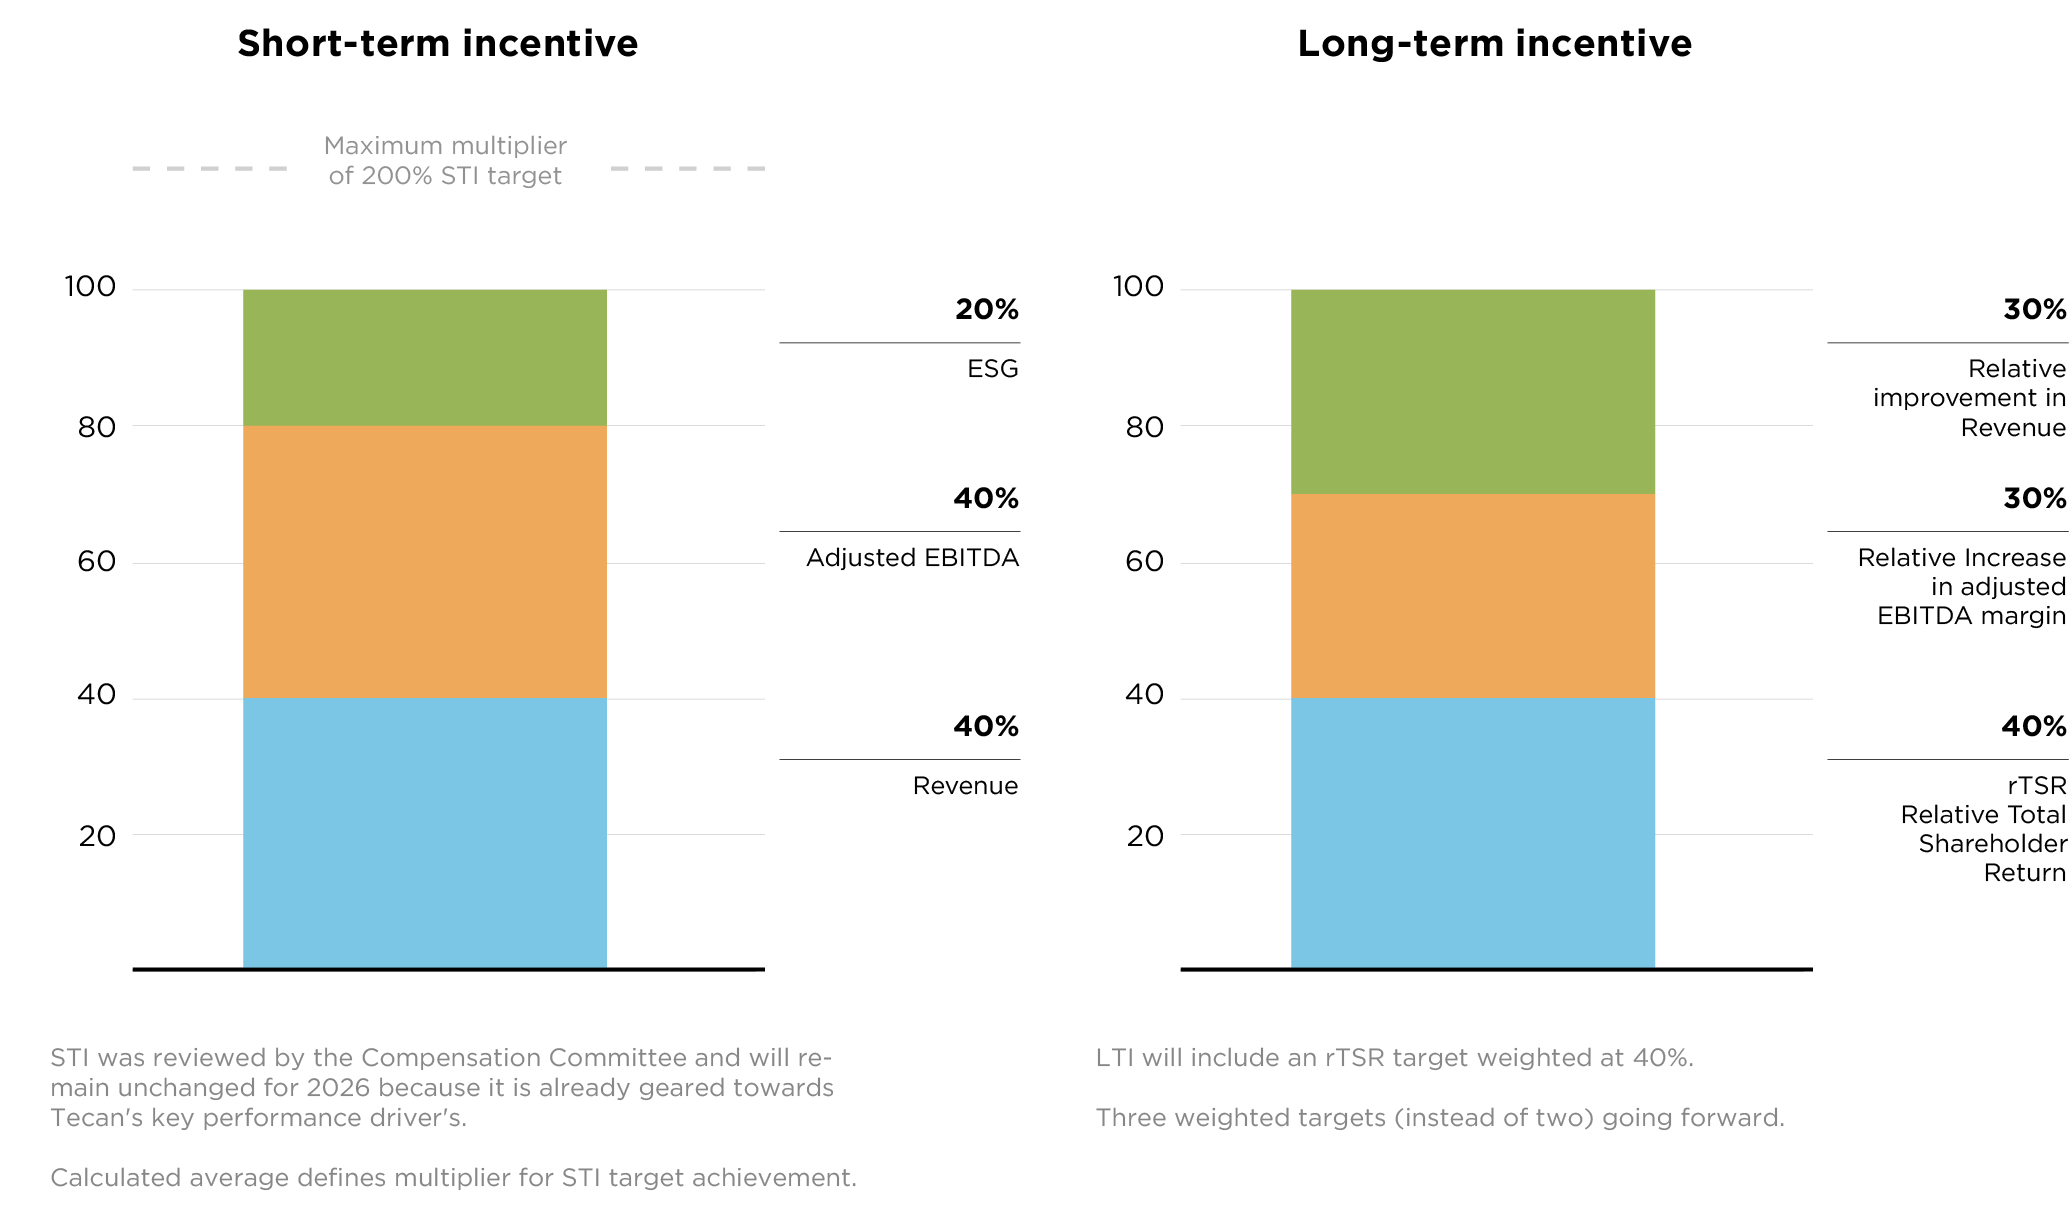
The STI remains unchanged for 2026, as it is already closely aligned with Tecan’s key performance drivers. The STI is based on three main components:
- Revenue (40%): Measured against the annual budget, reflecting the importance of top-line growth.
- Adjusted EBITDA margin (40%): Also based on the annual budget, emphasizing profitability and operational efficiency.
- ESG (20%): Based on annual sustainability targets, typically split into two goals, which are quantitively measurable, supporting Tecan’s commitment to environmental, social, and governance (ESG) objectives and directly linked to successful management of Tecan’s material topics.
The STI multiplier ranges from 0% (for below-threshold performance) to 200% of the target (for exceptional performance).
LONG-TERM INCENTIVE (LTI)
The LTI plan has been significantly enhanced with the introduction of the rTSR performance indicator, which accounts for 40% of the LTI weighting.
- rTSR (40%): The rTSR compares Tecan’s share price performance incl. dividends against a defined peer group, incentivizing outperformance relative to industry peers. In the peer group for the rTSR we include much larger companies from our industry to reflect the investors’ perspective and choice. Therefore, it differs from the salary benchmarking peer group. The payout curve for rTSR will start at the 25th percentile, reach the target at the 50th percentile and the maximum at the 62.5th percentile.
- Relative increase in adjusted EBITDA margin (30%): Focused on sustained profitability, including the impact of M&A activity, which is considered critical for Tecan’s long-term growth. The pay-out curve is linear.
- Relative improvement in revenue (30%): Measured as a compound annual growth rate (CAGR) over three years, excluding divestments which are considered critical for Tecan’s long-term strategy. Pay-out curve is linear.
This structure ensures that the LTI is closely tied to both financial performance and shareholder return. The LTI multiplier ranges from 0% (for below-threshold performance) to 200% of the target (for exceptional performance).
- rTSR peer group: 10xGenomics Inc., Abbot Laboratories, AddLife AB (publ), Agilent Technologies Inc., Bachem Holding AG, Bio-Rad Laboratories Inc., Bio-Techne Corporation, Bruker Corporation, Carl Zeiss Meditec AG, Danaher Corporation, DiaSorin S.p.A, GN Store Nord A/S, Hologic Inc., Lonza Group AG, Mettler-Toledo International Inc., Qiagen N.V., Revvity Inc., Siegfried Holding AG, Siemens Healthineers AG, Sonova Holding AG, Straumann Holding AG, Thermo Fisher Scientific Inc.
IMPROVED DISCLOSURE
To further increase transparency, Tecan will provide more detailed ex-post disclosure of STI and LTI performance targets and achievement levels as of the Compensation Report 2026 and going forward. This will give shareholders greater insight into how targets are set, how performance is measured, and how compensation outcomes are determined.
For the STI, detailed targets and achievement levels for ESG goals will be disclosed, while financial targets such as EBITDA and revenue will remain confidential for competitive reasons. For the LTI, ex-post disclosure will include rTSR achievement levels, revenue growth goals and achievement levels, with adjusted EBITDA growth targets remaining undisclosed due to commercial sensitivity.
Illustrative tables are included below to demonstrate how these disclosures will be presented as of the Compensation Report 2026, providing shareholders with a clearer understanding of how performance is measured and rewarded (pay-for-performance link).
EXAMPLE STI
| Year | Performance Objective | Definition | Goal weighting | Target (100% payout) | Actual achievement | Target achievement |
| STI Plan 2026 | EBITDA | Tecan Group EBITDA Margin 2025 | 40% | Commercially sensitive1 | Commercially sensitive1 | 100% |
| Revenue | Tecan Group Sales ABS value at B26FX | 40% | Commercially sensitive1 | Commercially sensitive1 | 150% | |
| ESG Target 1 | Enhance Tecan's Culture - Measured with Great Places To Work Index in the global survey 2025 | 10% | Reach 82% of participation for GPTW with trust index level 73% | 86% participation rate, 68% trust index | 80% | |
| ESG Target 2 | Energy management - Achieve 100% renewable electricity für 2025 and set energy reduction plan with a target supporting Tecan's SBTI Scope 1&2 target 2030 | 10% | 100% renewable electricity met, energy audits completed at sites, together responsible for two thirds of consumption, and an energy reduction target is set. | 90% renewable energy met, with all energy audits completed for two-thirds of energy consumption. An energy reduction target is set. | 90% | |
| total achievement over plan period | 117.00% | |||||
- Target and actual achievement is not disclosed due to competitive nature of the metric.
EXAMPLE LTI
| Year | Performance Objective | Definition | Goal weighting | Target (100% payout) | Actual achievement | Target achievement |
| LTI Plan 2026 | rTSR | Relative Total Shareholder Return, based on the dividend-adjusted average share price, comparing the average of all closing prices for each year of the Performance Cycle to those of the peer group (TSR 365 approach). The performance is expressed as a percentile ranking in the peer group. | 40% | 50th %-ile | 62.5th %-ile | 200% |
Adjusted EBITDA percentage improvement | Operating profit before depreciation and amortization adjusted for restructuring, acquisition and integration related costs in percentage of total sales. | 30% | Commercially sensitive1 | Commercially sensitive1 | 150% | |
| Net Revenue CAGR | Total sales of Tecan Group Ltd. including all entities and subsidiaries as disclosed in the financial statements and audited based on the IFRS accounting standards compared to the total sales in the previours year expressed as a percentage | 30% | 20% | 18% | 80% | |
| total achievement over plan period | 117.00% | |||||
- Target and actual achievement is not disclosed due to competitive nature of the metric.
These changes reflect Tecan’s commitment to best practices in executive compensation, ensuring that the compensation system is fair, competitive, and aligned with the interests of our shareholders.