

ORDER ENTRY AND SALES
Order entry for the Group reached CHF 900.9 million for full-year 2025 (2024: CHF 903.6 million), declining by 0.3% in Swiss francs but growing by 3.8% in local currencies. The book-to-bill ratio was above 1 in both business segments. In the second half, order entry grew by 8.6% in local currencies and by 2.6% in Swiss francs.
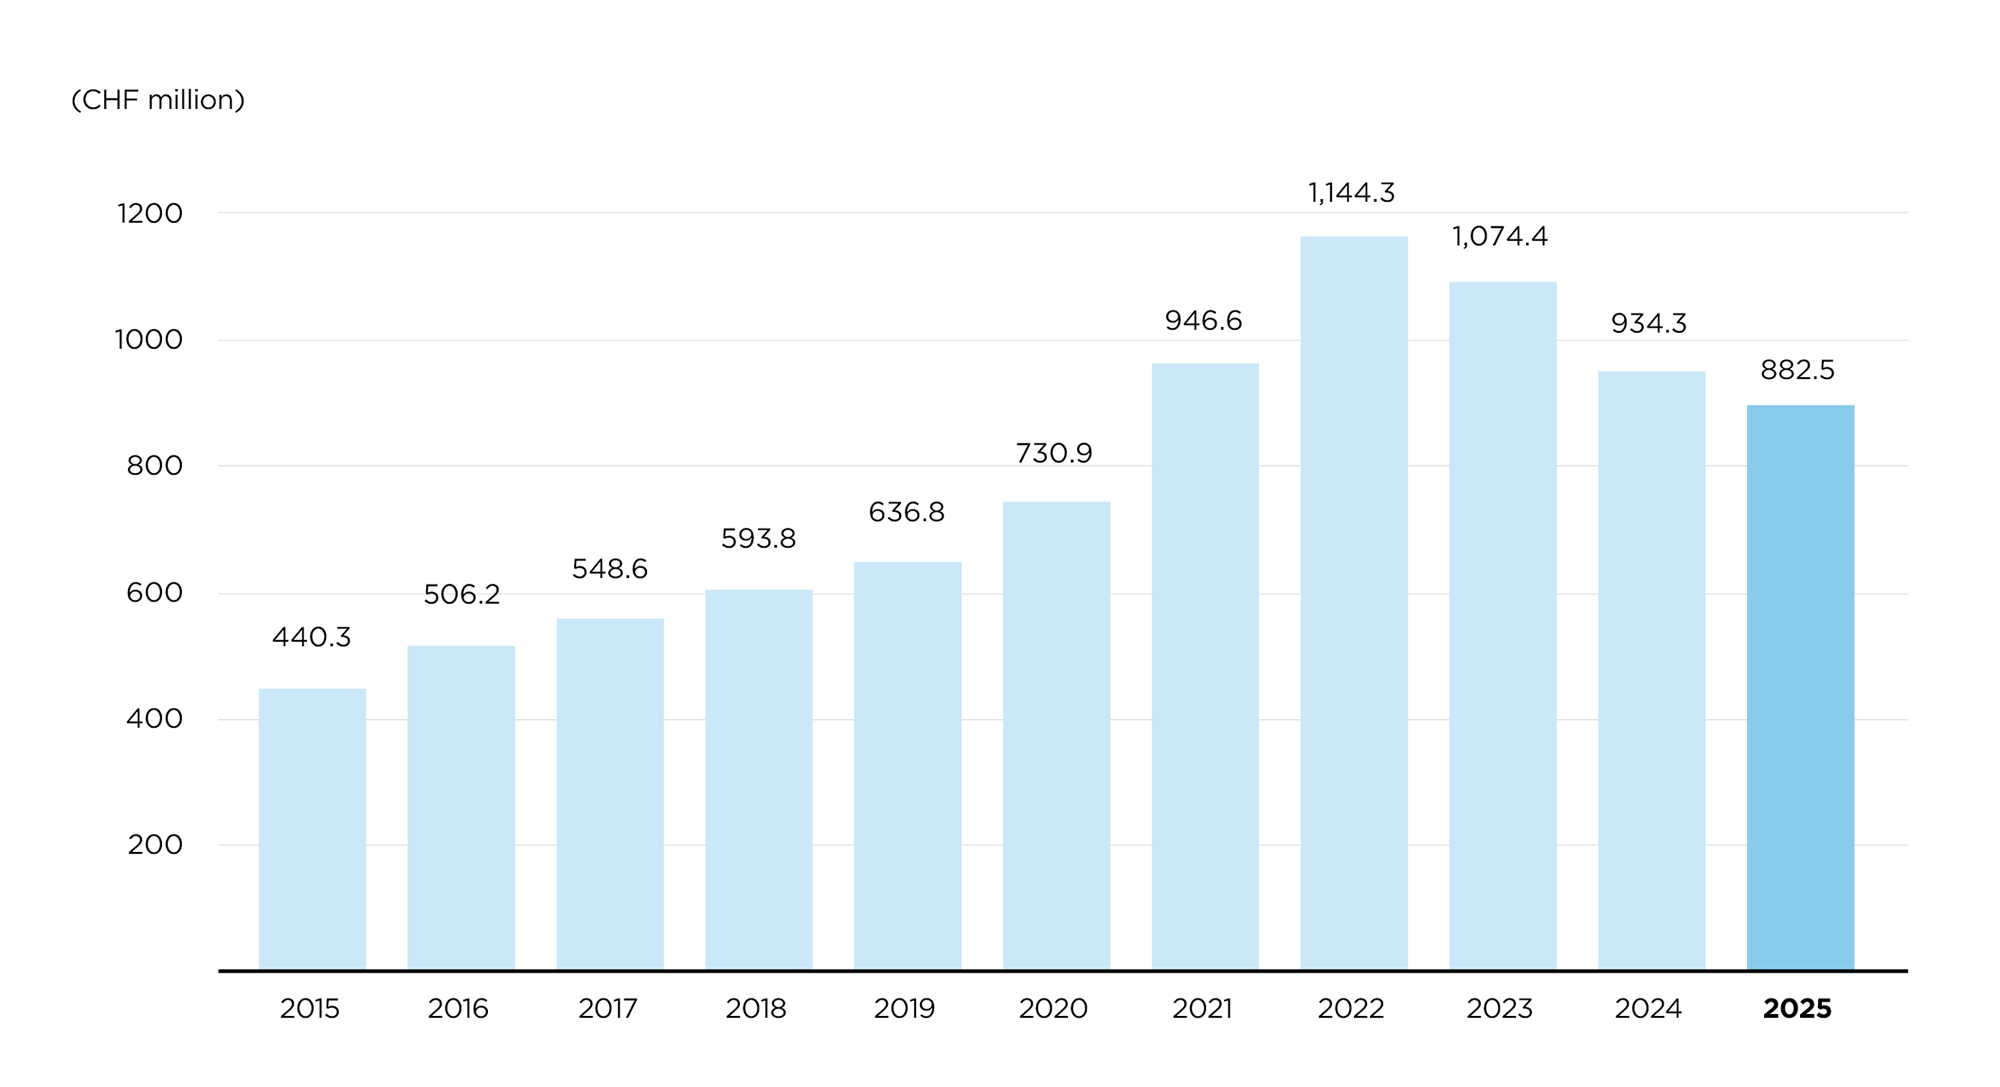
Group sales for 2025 decreased by 1.6% in local currencies and 5.5% in Swiss francs, totaling CHF 882.5 million (2024: CHF 934.3 million). In the second half of the year, Tecan returned to moderate sales growth, with sales increasing by 0.4% in local currencies. Sales declined by 5.2% in Swiss francs to CHF 443.0 million (2024: CHF 467.1 million).

SALES DEVELOPMENT 2015-2025
| CHF million | 2024 | 2025 | Δ in % |
| Order Entry | 903.6 | 900.9 | -0.3% |
| Order Entry in local currencies | 868.1 | 900.9 | +3.8% |
| Sales | 934.3 | 882.5 | -5.5% |
| Sales in local currencies | 896.6 | 882.5 | -1.6% |
SEGMENT SALES
LIFE SCIENCES BUSINESS (END-CUSTOMER BUSINESS)
Sales in the Life Sciences Business reached CHF 377.1 million (2024: CHF 397.0 million), representing a decrease of 1.0% in local currencies and 5.0% in Swiss francs. In the second half, sales declined by 3.2% in local currencies. During 2025, demand for instruments in Academia & Government was significantly impacted by budget uncertainty and volatile public funding, particularly in the US and China. Biopharma sales were slightly below the prior year in local currencies, with order entry picking up significantly in the second half. Diagnostic accounts continued to see solid sales and order growth in local currencies throughout the year.
Order entry in the Life Sciences Business increased in the low single-digit percentage range in local currencies for the full year, with an acceleration in the second half. The book-to-bill ratio remained above 1 in 2025.
PARTNERING BUSINESS (OEM BUSINESS)
The Partnering Business recorded sales of CHF 505.4 million (2024: CHF 537.3 million), representing a decrease of 2.0% in local currencies and 5.9% in Swiss francs. In the second half, sales increased by 3.3% in local currencies.
Overall weak demand for life science instrumentation negatively impacted sales of Cavro OEM components and Paramit CDMO manufacturing services. In contrast, strength in diagnostics drove solid growth in local currencies for in-vitro diagnostics systems in the Synergence product line.
Order entry in the Partnering Business grew at a mid-single-digit rate in local currencies for the full year. As expected, order entry accelerated significantly in the second half, with growth in the low double-digit percentage range. The book-to-bill ratio was also above 1 for this segment in 2025.
GROSS PROFIT
Gross profit reached CHF 310.8 million (2024: CHF 320.6 million), which was CHF 9.8 million or 3.0% below the prior-year figure. The gross profit margin increased to 35.2% of sales (2024: 34.3%), despite a negative impact from tariffs.
Main effects contributing to the gross profit margin level:
- (+) Product mix
- (+) Price increases
- (+) Efficiency and cost improvements
- (-) Tariffs
- (-) Lower sales volumes
- (-) FX
OPERATING EXPENSES LESS COST OF SALES
Total operating expenses, excluding cost of sales, were CHF 268.7 million or 30.4% of sales (2024: CHF 251.7 million or 26.9% of sales). The increase was primarily due to one-time costs in G&A, including restructuring, and higher performance-related compensation across functions compared to the low levels in 2024. These effects were partly offset by strict cost control and lower salary expenses resulting from a reduced headcount.
OPERATING PROFIT
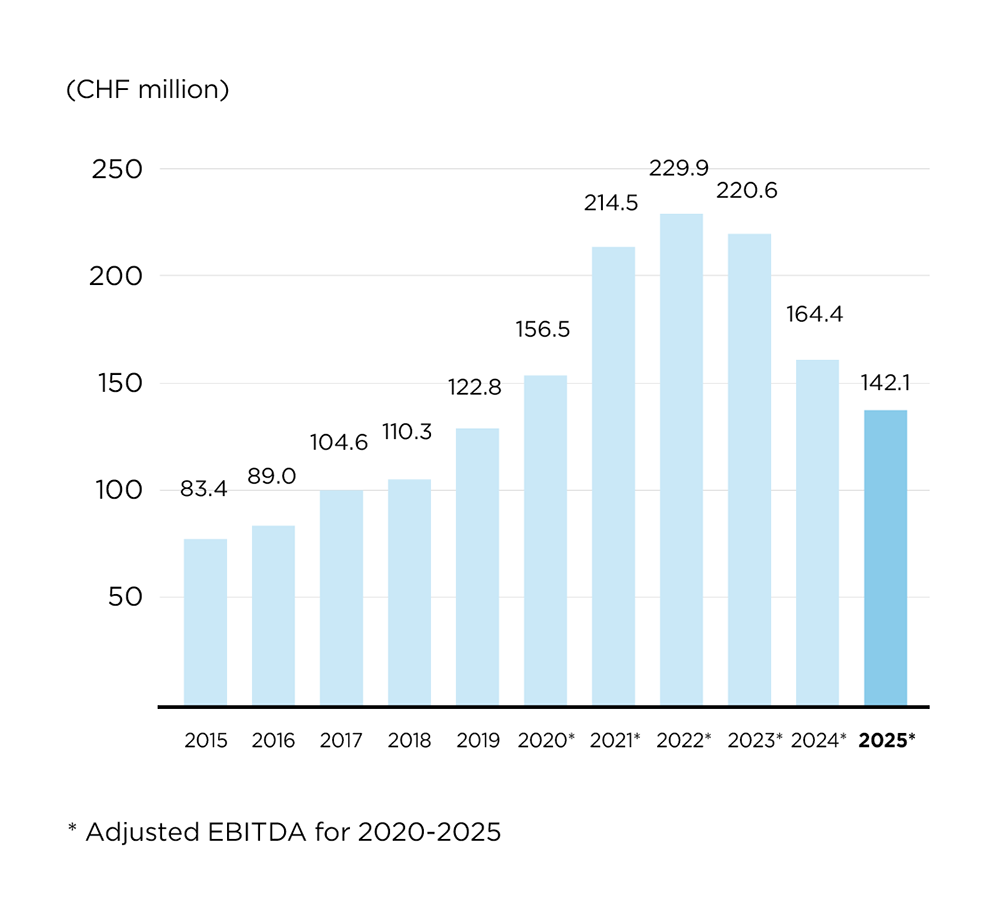
Adjusted EBITDA1 (operating profit before depreciation and amortization) was CHF 142.1 million, down from CHF 164.4 million in 2024. The adjusted EBITDA margin decreased to 16.1% of sales (2024: 17.6%). Margins were significantly impacted by adverse foreign exchange effects (-130 basis points) and tariffs (-70 basis points), partly offset by underlying improvements (+50 basis points). Excluding the combined 200 basis point headwind from foreign exchange effects and tariffs, the adjusted EBITDA margin was 18.1%, in line with the outlook communicated on March 12, 2025. Reported EBITDA was CHF 117.1 million, compared to CHF 148.0 million in the prior year, corresponding to reported margins of 13.3% and 15.8%, respectively.
EBITDA DEVELOPMENT 2015-2025
SEGMENT PROFITABILITY
LIFE SCIENCES BUSINESS (END-CUSTOMER BUSINESS)
Reported EBIT (earning before interest and taxes) in the Life Sciences Business segment was CHF 25.7 million (2024: CHF 39.5 million), with the reported operating profit margin decreasing to 6.7% of sales (2024: 9.8%). The segment absorbed the majority of the negative impact from foreign exchange rates and tariffs. In addition, as part of the portfolio optimization, Tecan decided to exit activities at Tecan Genomics which do not meet the criteria for value creation, resulting in a CHF 5.3 million asset write-off. Cost control measures partially offset these negative effects. Adjusted EBITDA3 for the segment was CHF 63.4 million (2024: CHF 79.1 million), reflecting an adjusted EBITDA margin of 16.5% of sales (2024: 19.6%).
PARTNERING BUSINESS (OEM BUSINESS)
Reported EBIT in the Partnering Business amounted to a loss of CHF 103.6 million (2024: profit of CHF 46.6 million), primarily due to the non-cash impairment charge of CHF 139.5 million from the strategic restructuring of less profitable or loss-making product lines. Adjusted EBITDA3 for the segment was CHF 89.7 million (2024: CHF 91.1 million), reflecting an adjusted EBITDA margin of 17.7% of sales (2024: 16.9%). The adjusted EBITDA margin increased, mainly due to a positive product mix and strong cost control, which outweighed the adverse effects of foreign exchange and tariffs.
NET PROFIT AND EARNINGS PER SHARE
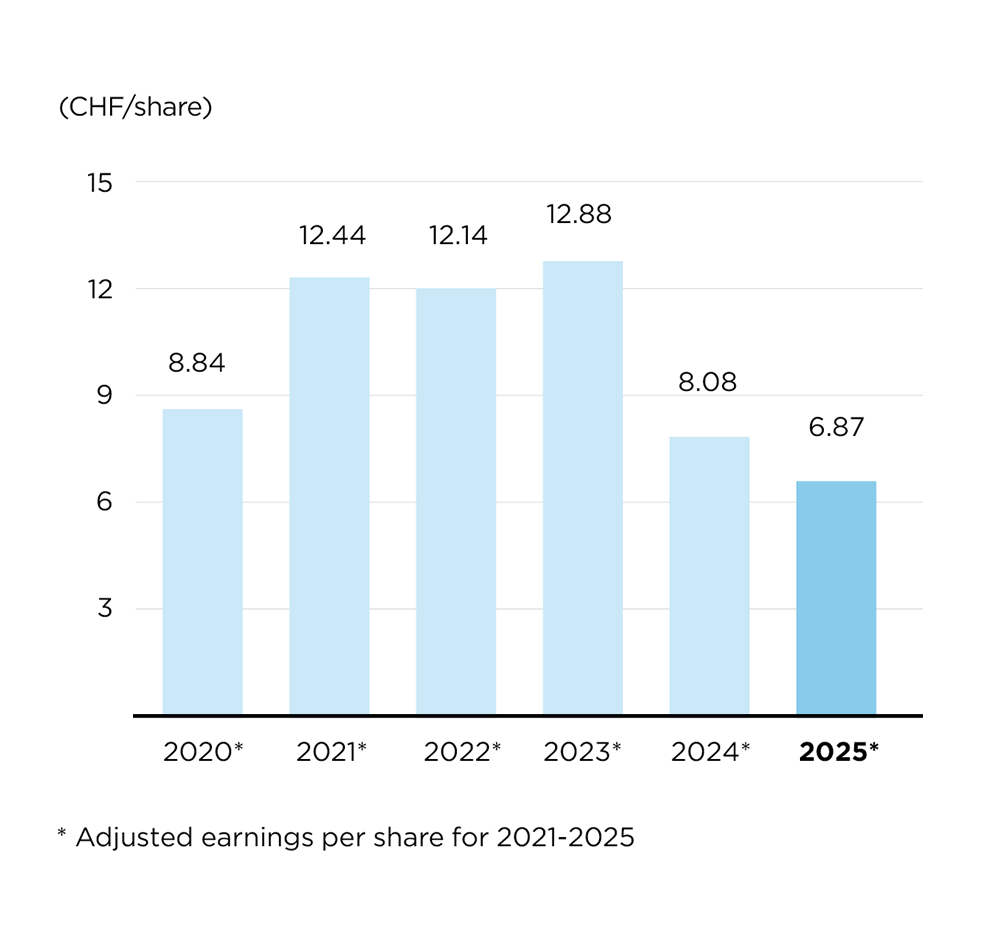
Net profit was impacted by non-cash impairment charges of CHF 139.5 million from the strategic restructuring of less profitable or loss-making product lines in the Partnering Business. Tecan will leverage synergies between its design and development capabilities and Paramit’s manufacturing capabilities, discontinuing dedicated design functions acquired in 2021. As a result of the impairment charges, the Company reported a net loss of CHF 110.7 million (2024: net profit of CHF 67.7 million). In addition to a lower operating profit, net profit was further weighed down by a reduced financial result, mainly reflecting negative foreign exchange effects and the translation of US dollar denominated assets into Swiss francs. Reported basic earnings per share were CHF -8.74 (2024: CHF 5.30). Adjusted net profit2 amounted to CHF 87.0 million (2024: CHF 103.1 million), with adjusted earnings per share2 of CHF 6.87 (2024: CHF 8.08).
EARNINGS PER SHARE DEVELOPMENT 2020-2025
CASH FLOW
Cash flow from operating activities was CHF 138.0 million, compared to CHF 148.5 million in 2024. Cash conversion improved to 118% of reported EBITDA (2024: 100%). Thanks to solid cash flow management, Tecan’s net liquidity position (cash and cash equivalents plus short-term time deposits, less bank liabilities, loans, and the outstanding bond) increased to CHF 160.8 million as of December 31, 2025, up from CHF 153.7 million on December 31, 2024.
Through its share buyback program, from August 2025 to December 31, 2025, Tecan purchased own shares with a value of CHF 33.4 million. The program allows for the repurchase of registered shares with a value of up to CHF 120 million.
BALANCE SHEET AND EQUITY RATIO
Shareholder’s equity at December 31, 2025 was at CHF 1,151.5 million (December 31, 2024: CHF 1,435.3 million). Tecan's equity ratio increased to 67.8% as of December 31, 2025 (December 31, 2024: 67.7%).

Tania Micki
Chief Financial Officer
- The adjusted operating profit before depreciation and amortization excludes restructuring costs as well as acquisition- and integration-related costs (+CHF 25.0 million)
- The calculation of 2024 adjusted net profit and adjusted earnings per share excludes restructuring costs as well as acquisition- and integration-related costs (+CHF 16.4 million) and accumulated amortization of acquired intangible assets (+CHF 19.0 million) and they were calculated with the reported Group tax rate of 13.6%.
- The adjusted operating profit before depreciation and amortization for the Life Sciences Business segment excludes restructuring costs as well as acquisition- and integration-related costs (+CHF 8.1 million). The adjusted operating profit before depreciation and amortization for the Partnering Business segment excludes restructuring costs as well as acquisition- and integration-related costs (+CHF 14.4 million).
RECONCILIATION OF ADJUSTED CONSOLIDATED STATEMENT OF PROFIT OR LOSS
2024 | 2025 | ||
| CHF 1,000 / unaudited |
|
| |
| Sales | 934,278 | 882,480 | |
|
| ||
| GAAP operating profit (EBIT) | 75,573 | (91,423) | |
|
| ||
| Depreciation and amortization | 72,407 | 208,531 | |
|
| ||
| Non-GAAP EBITDA | 147,980 | 117,108 | |
| In % of sales | 15.8% | 13.3% | |
|
| ||
| Adjustments for |
|
| |
| Acquisition and integration costs | 16,434 | 24,992 | |
| Swiss pension plans: past service costs | - | - | |
|
| ||
| Non-GAAP adjusted EBITDA | 164,414 | 142,100 | |
| In % of sales | 17.6% | 16.1% | |
|
| ||
| Depreciation and amortization | (66,805) | (206,397) | |
| Adjustment for acquisition-related amortization | 18,983 | 162,840 | |
|
| ||
| Non-GAAP adjusted EBIT | 116,592 | 98,543 | |
| In % of sales | 12.5% | 11.2% | |
|
| ||
| Financial result | (2,704) | (2,689) | |
|
| ||
| Non-GAAP adjusted profit before taxes | 119,296 | 95,854 | |
| In % of sales | 12.8% | 10.9% | |
|
| ||
| Adjusted income taxes | (16,177) | (8,895) | |
|
| ||
| Non-GAAP adjusted net profit | 103,119 | 86,959 | |
| In % of sales | 11.0% | 9.9% | |
|
| ||
| Non-GAAP adjusted basic earnings per share (CHF) | 8.08 | 6.87 |