- The Stories
- Investor Relations
- Corporate Governance
- 1 Group structure and shareholders
- 2 Capital structure
- 3 Board of Directors
- 4 Management
- 5 Content and method of determining compensation and stock option plans
- 6 Shareholders’ participation rights
- 7 Change of control and defense measures
- 8 Statutory auditors
- 9 Information policy
- 10 Blackout periods
- Compensation Report
- Financial Report 2023
- Chief Financial Officer’s Report
- Five-year consolidated data
- Consolidated financial statements
- Notes to the consolidated financial statements
- 1 Reporting entity
- 2 Summary of material accounting policies
- 3 Scope of consolidation
- 4 Sales – revenue from contracts with customers
- 5 Sales – income from operating lease arrangements (group as lessor)
- 6 Segment information
- 7 Operating expenses by nature
- 8 Research and development
- 9 Other operating result
- 10 Financial result
- 11 Earnings per share
- 12 Employee benefits
- 13 Income taxes
- 14 Cash and cash equivalents
- 15 Other current financial assets
- 16 Trade accounts receivable
- 17 Inventories
- 18 Non-current financial assets
- 19 Property, plant and equipment
- 20 Right-of-use assets (group as lessee)
- 21 Intangible assets and goodwill
- 22 Financial liabilities
- 23 Contract liabilities
- 24 Government grants
- Statutory Auditor´s Report on the Consolidated Financial Statements
- Balance sheet of Tecan Group Ltd.
- Income statement of Tecan Group Ltd.
- Notes to the financial statements of Tecan Group Ltd.
- 1 Reporting entity
- 2 Summary of significant accounting policies
- 3 Investments in subsidiaries
- 4 Bond
- 5 Provision for general business risks
- 6 Shareholders’ equity
- 7 Number of employees
- 8 Number of shares and share options
- 9 Guarantees in favor of third parties
- 10 Liabilities from lease arrangements not included in the balance sheet
- 11 Subsequent events
- 12 Information according to article 663c of the Swiss code of obligations
- Statutory Auditor`s Report on the Financial Statements of Tecan Group Ltd.
- Performance of the Tecan share in 2023
Chief Financial Officer’s Report
"I am particularly pleased with the 25.2% increase in cash flow from operating activities."
Tania Micki
Chief Financial Officer
ORDER ENTRY AND SALES
Full-year order entry was CHF 1,028.1 million (2022: CHF 1,132.9 million or CHF 1,078.1 million when compared in local currencies), down 9.3% year-on-year, or 4.6% in local currencies compared to the substantial order entry in 2022, when COVID-related orders as well as orders related to the material cost pass-through still contributed to the high order intake. With solid inflow of new orders close to the level of sales, the book-to-bill ratio reached a value of 0.96. Excluding the effects of lower COVID-related orders and orders related to the pass-through of material costs, underlying order entry grew in the low single-digit percentage range in local currencies.
Order entry improved in the second half of the year and was just 1.9% below the previous year's figure in local currencies, after a more significant decline in the first half of the year.
Underlying sales for fiscal year 2023 increased by 6.3% in local currencies, despite a challenging market environment and cautious investment behavior among many customers. Underlying sales exclude the effects of lower COVID- related sales (estimated net effect of CHF -58.5m in local currencies) and a lower pass-through of material costs compared to the prior-year period (net effect of CHF -19.7m). In the second half of the year, underlying sales increased by 5.5% in local currencies.
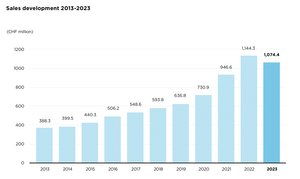
Reported sales for fiscal year 2023 decreased in comparison to fiscal year 2022 by 6.1% in Swiss francs and reached CHF 1,074.4 million, including a substantial negative exchange rate effect (2022: CHF 1,144.3 million or CHF 1,089.0 million when compared in local currencies). Reported sales were 1.3% below the prior-year period when measured in local currencies. Reported sales in the second half decreased by 4.9% in Swiss francs and rose by 1.0% in local currencies.
Reported full-year sales in 2023 also include a significant reduction of pass-through sales compared to 2022, sooner and to a much greater extent than anticipated. As these sales do not generate a margin from passing on higher material costs, this is a desirable development.
SEGMENT SALES
Life Sciences Business (end-customer business)
Sales in the Life Sciences Business reached CHF 451.8 million (2022: CHF 492.3 million or CHF 466.0 million in local currencies), a decrease of 8.2% in Swiss francs or 3.0% in local currencies compared to 2022. In contrast, underlying sales increased by 4.9% in local currencies, excluding the impact of lower COVID-related sales compared to the same period last year (estimated net effect of CHF -35.1 million in local currencies, based on an allocation of 60% of total COVID-related sales in 2022).
Thanks to good growth in the service business due to the higher installed base of instruments, recurring sales of services, consumables and reagents increased to 52.8% of segment sales (2022: 51.0%).
In the second half of the year, underlying sales increased by 4.4% in local currencies and reported sales rose by 1.6% in local currencies.
As new orders were only slightly lower than sales, the ratio of new orders to sales (book-to-bill) also normalized to a value close to 1.
Partnering Business (OEM business)
The Partnering Business generated sales of CHF 622.6 million during the year under review (2022: CHF 652.0 million), which corresponds to a decrease of 4.5% in Swiss francs and 0.1% in local currencies. Underlying sales increased by 7.4% in local currencies, excluding the impact of lower COVID-related sales and a lower pass-through of material costs compared to the same period last year (estimated net effect of CHF -23.4 million in local currencies and CHF -19.7 million, respectively).
The increase in underlying sales is primarily due to double-digit growth in the Paramit product line, driven primarily by the medical business, which also benefited from pent-up demand for certain medical products after the end of the pandemic.
By contrast, sales of Cavro®OEM components declined substantially, as these products had experienced a significant surge in demand in the prior-year period to mitigate disruptions in the supply chain and in the run-up to the transfer of production to two new manufacturing sites.
Demand for in-vitro diagnostics systems for the Synergence™ product line remained solid and sales in local currencies were nearly unchanged year-on-year.
New orders in the Partnering Business were only slightly lower than sales, the book-to-bill ratio came close to 1.
Regional development
In Europe, Tecan's full-year reported sales in 2023 were still affected by a COVID-related high comparative basis and weaker demand and developed accordingly at -22.6% in Swiss francs and -19.9% in local currencies. Against the high comparative basis, sales in the Life Sciences Business were 14.1% lower than the previous year in local currencies, and in the Partnering Business they declined by 24.2% in local currencies.
In the second half of the year, sales in Europe decreased by 24.6% in local currencies for the Group and by 7.7% and 36.2% for the Life Sciences Business and Partnering Business segments respectively.
In North America, reported sales grew by 5.8% in Swiss francs and by 11.8% in local currencies. Despite the high COVID-related basis of comparison and more cautious spending behavior, sales in the Life Sciences Business segment increased by 5.1% in local currencies. The Partnering Business segment reported a 16.4% increase in sales in local currencies, driven by strong sales growth in the medical business, which more than offset COVID-related sales in other product categories from 2022.
Sales growth in North America accelerated in the second half of 2023, rising by 17.1% in local currencies. Both business segments contributed to this acceleration in the second half of the year, with the Life Sciences Business growing by 13.1% in local currencies and the Partnering Business by 19.6%.
In Asia, full-year reported sales in 2023 decreased by 8.0% in Swiss francs and 1.7% in local currencies. In the second half of the year, by contrast, sales rose by 7.7% in local currencies. However, the development of sales in the two business segments was very different in the two half-year periods. While the Partnering Business was still affected by a high COVID-related basis for comparison and a decline in sales of Cavro components in the first half of the year, segment sales rose by 25.5% in local currencies in the second half of the year. The Partnering Business therefore closed the year as a whole with only a slight loss in sales of 2.9% in local currencies.
In contrast, the Life Sciences Business segment recorded a significant increase in sales in local currencies in the first half of the year but experienced an almost identical decline in sales of 9.8% in local currencies in the second half of the year, mainly due to the market weakness in China. For 2023 as a whole, sales in the Life Sciences Business segment in Asia thus remained almost unchanged at -0.3% in local currencies.
GROSS PROFIT
Gross profit reached 390.5 million Swiss Francs (2022: CHF 438.1 million), which was 47.6 million or 10.9% below the prior-year figure. The decline is mainly due to the lower sales volume, which was also the primary factor behind the gross profit margin of 36.3% of sales (2022: 38.3%). Price increases, cost improvements and lower revenue from passing on higher material costs without a margin compensated for the decline in volume, but a less favorable product mix, higher depreciation on production equipment for consumables and acquisition-related integration costs led to the overall lower gross profit margin.
Main effects contributing to the gross profit margin level:
- (-) Lower sales volumes
- (-) Product mix
- (-) Increased depreciation of consumable production lines
- (-) Acquisition-related costs
- (+) Price increases
- (+) Efficiency and cost improvements
- (+) Lower revenue from passing on higher material costs without a margin
OPERATING EXPENSES LESS COST OF SALES
Thanks to effective cost control, operating expenses fell by 10.5% and amounted to CHF 261.3 million or 24.3% of sales in 2023 (2022: CHF 292.1 million or 25.5% of sales).
Sales and Marketing expenses decreased by 10.0% to CHF 119.6 million (2022: CHF 132.8 million). As a percentage of sales, they reached 11.1% of sales (2022: 11.6%).
At an absolute level, net research and development expenses decreased to CHF 69.7 million (2022: CHF 77.9 million). As the share of Partnering Business sales has increased in relation to total sales and it is less deve- lopment-intensive, as the activities are largely financed by OEM customers, research and development costs accounted for 6.5% of total sales (2022: 6.8%).
Overall R&D activities and gross expenses (“gross R&D”), including capitalization of development costs and customer funding of OEM projects, were at CHF 89.6 million (2022: CHF 94.0 million). They increased as a percentage of sales to 8.3% of sales (2022: 8.2%) with higher customer funding of OEM projects and continued investments in innovation to position the business for sustained accelerated growth. Capitalization of development costs increased to CHF 12.3 million (2022: CHF 11.6 million), while amortization from capitalized development costs was almost unchanged at CHF 16.7 million (2022: CHF 16.9 million).
General and administration expenses decreased by 11.5% to CHF 72.0 million (2022: CHF 81.4 million). As a percentage of sales, G&A cost decreased to 6.7% of sales (2022: 7.1%).
OPERATING PROFIT
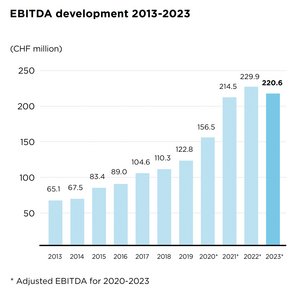
At CHF 220.6 million, adjusted operating profit before depreciation and amortization1 (earnings before interest, taxes, depreciation and amortization; EBITDA) was slightly below the previous year's level (2022: CHF 229.9 million), mainly due to lower sales volumes and a negative impact from exchange rate movements in major currencies versus the Swiss franc. The adjusted EBITDA margin nevertheless increased to 20.5% of sales (2022: 20.1%).
The reported profit before interest and taxes, EBIT, was at CHF 136.0 million (2022: CHF 147.8 million). Reported EBITDA reached CHF 207.3 million in the fiscal year 2023 (2022: CHF 214.9 million).
Segment profitability
Life Sciences Business (end-customer business)
Reported operating profit in the Life Sciences Business segment (earnings before interest and taxes; EBIT) reached CHF 84.4 million (2022: CHF 87.1 million). The operating profit margin rose to 18.3% of sales (2022: 17.1%), supported by price increases and cost control and despite the lower sales volumes and an adverse exchange rate effect.
Partnering Business (OEM business)
Reported operating profit in this segment (earnings before interest and taxes; EBIT) amounted to CHF 64.4 million (2022: CHF 74.4 million), while the reported operating profit margin reached 10.3% of sales (2022: 11.4%). The integration costs and amortization of acquired intangible assets in connection with the acquisition of Paramit were recognized for the Group in the Partnering Business segment. Other factors negatively impacting the segment margin were the lower sales volumes with corresponding negative economies of scale and a more negative product mix.
NET PROFIT AND EARNINGS PER SHARE
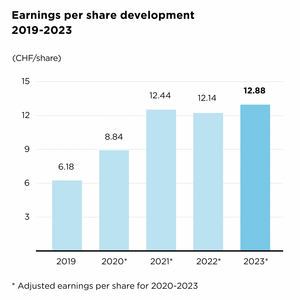
Adjusted net profit2 increased to CHF 164.4 million (2022: CHF 154.4 million), supported by a one-time positive effect in connection with transitional measures from the Swiss tax reform. Adjusted earnings per share rose to CHF 12.88 (2022: CHF 12.14). Reported net profit for 2023 increased to CHF 132.1 million (2022: CHF 121.1 million), while basic earnings per share grew to CHF 10.34 (2022: CHF 9.53).
BALANCE SHEET AND EQUITY RATIO
Shareholder’s equity at December 31, 2023 was at CHF 1,348.9 million (December 31, 2022: CHF 1,357.7 million). Tecan's equity ratio increased to 65.0% as of December 31, 2023 (December 31, 2022: 64.2%).
CASH FLOW
Cash flow from operating activities increased by 25.2% to CHF 160.6 million in 2023 (2022: CHF 128.3 million). In the prior-year period, inventories and safety stocks increased to ensure delivery capability in times of tight material supplies. These inventories have now been increasingly reduced again. Thanks to the strong cash flow, Tecan’s net liquidity position (cash and cash equivalents plus short-term time deposits less bank liabilities, loans and the outstanding bond) increased to CHF 112.6 million (December 31, 2022: CHF 41.2 million).

Tania Micki
Chief Financial Officer
- The adjusted operating profit before depreciation and amortization excludes acquisition- and integration-related costs (+CHF 17.7 million) as well as one-time pension plan effects (-CHF 4.4 million).
- The calculation of 2023 adjusted net profit and adjusted earnings per share excludes acquisition- and integration-related costs (+CHF 17.7 million), one-time pension plan effects (-CHF 4.4 million) as well as the accumulated amortization of acquired intangible assets (+CHF 19.5 million) and they were calculated with the reported Group tax rate of 1.3%.
Reconciliation of adjusted consolidated statement of profit or loss
|
| 2022 | 2023 |
CHF 1,000 / unaudited |
|
|
|
Sales |
| 1,144,261 | 1,074,386 |
|
|
|
|
GAAP operating profit (EBIT) |
| 147,835 | 135,967 |
|
|
|
|
Depreciation and amortization |
| 67,054 | 71,330 |
|
|
|
|
Non-GAAP EBITDA |
| 214,889 | 207,297 |
In % of sales |
| 18.8% | 19.3% |
|
|
|
|
Adjustments for |
|
|
|
Acquisition and integration costs |
| 13,559 | 17,654 |
Swiss pension plans: past service costs |
| 1,497 | (4,358) |
|
|
|
|
Non-GAAP adjusted EBITDA |
| 229,945 | 220,593 |
In % of sales |
| 20.1% | 20.5% |
|
|
|
|
Depreciation and amortization |
| (66,407) | (71,330) |
Adjustment for acquisition-related amortization |
| 23,473 | 19,513 |
|
|
|
|
Non-GAAP adjusted EBIT |
| 187,011 | 168,776 |
In % of sales |
| 16.3% | 15.7% |
|
|
|
|
Financial result |
| (5,350) | (2,162) |
|
|
|
|
Non-GAAP adjusted profit before taxes |
| 181,661 | 166,614 |
In % of sales |
| 15.9% | 15.5% |
|
|
|
|
Adjusted income taxes |
| (27,232) | (2,166) |
|
|
|
|
Non-GAAP adjusted net profit |
| 154,429 | 164,448 |
In % of sales |
| 13.5% | 15.3% |
|
|
|
|
Non-GAAP adjusted basic earnings per share (CHF) |
| 12.14 | 12.88 |
Follow Tecan