- The Stories
- Investor Relations
- Corporate Governance
- 1 Group structure and shareholders
- 2 Capital structure
- 3 Board of Directors
- 4 Management
- 5 Content and method of determining compensation and stock option plans
- 6 Shareholders’ participation rights
- 7 Change of control and defense measures
- 8 Statutory auditors
- 9 Information policy
- 10 Blackout periods
- Compensation Report
- Financial Report 2023
- Chief Financial Officer’s Report
- Five-year consolidated data
- Consolidated financial statements
- Notes to the consolidated financial statements
- 1 Reporting entity
- 2 Summary of material accounting policies
- 3 Scope of consolidation
- 4 Sales – revenue from contracts with customers
- 5 Sales – income from operating lease arrangements (group as lessor)
- 6 Segment information
- 7 Operating expenses by nature
- 8 Research and development
- 9 Other operating result
- 10 Financial result
- 11 Earnings per share
- 12 Employee benefits
- 13 Income taxes
- 14 Cash and cash equivalents
- 15 Other current financial assets
- 16 Trade accounts receivable
- 17 Inventories
- 18 Non-current financial assets
- 19 Property, plant and equipment
- 20 Right-of-use assets (group as lessee)
- 21 Intangible assets and goodwill
- 22 Financial liabilities
- 23 Contract liabilities
- 24 Government grants
- Statutory Auditor´s Report on the Consolidated Financial Statements
- Balance sheet of Tecan Group Ltd.
- Income statement of Tecan Group Ltd.
- Notes to the financial statements of Tecan Group Ltd.
- 1 Reporting entity
- 2 Summary of significant accounting policies
- 3 Investments in subsidiaries
- 4 Bond
- 5 Provision for general business risks
- 6 Shareholders’ equity
- 7 Number of employees
- 8 Number of shares and share options
- 9 Guarantees in favor of third parties
- 10 Liabilities from lease arrangements not included in the balance sheet
- 11 Subsequent events
- 12 Information according to article 663c of the Swiss code of obligations
- Statutory Auditor`s Report on the Financial Statements of Tecan Group Ltd.
- Performance of the Tecan share in 2023
Data
In the previous sections of the Sustainability Report, Tecan’s management of material topics is described. The management of material topics generates data that can indicate if a revised approach or new business activities are needed: the data is used in business decisions. For material topics that generate a significant amount of data, such as management of environmental impact and Tecan’s role as an employer, the data related to these topics is shared here.
Environmental Data
Tecan calculates greenhouse gas emissions annually and aims to calculate scope 1 and scope 2 emissions and certain scope 3 emissions quarterly in future, once the data collection and management system to facilitate this is in place. Energy consumption, water use and waste data are also tracked annually, and increased frequency of collection of this data is being evaluated in 2024. An additional metric used to track progress towards our overall aim of emissions reduction is the collection of supplier environmental data. As the baseline year, 2022 was chosen for reasons of total global footprint data availability and quality.
Progress towards Tecan’s greenhouse gas emissions reduction target is currently measured annually through the footprint calculation exercise. Progress towards being able to make this calculation more frequently than annually is measured and reported on internally quarterly, when the Management Board receives updates on the progress of the implementation of new a data collection and management system, as well as on the progress and results of Tecan’s Responsible Sourcing program.
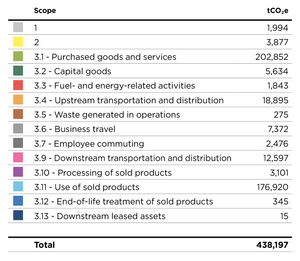
Tecan’s greenhouse gas emissions decreased overall in 2023. This is attributable to factors including:
- A small reduction in materials purchased and products sold;
- Successful implementation of reduction in the distance products are shipped;
- More specific data regarding use of sold products, enabling lower-emissions energy use to be assigned to a greater number of sold products.
Emissions due to business travel, driving and scope 1 energy use increased, and all areas present opportunities for emissions reduction in the near term.
Tecan will continue to pursue the emissions reduction and environmental management activities described in the Climate Impact section of this report.
| 2023 | 2022 | 2021 (limited footprint) | ||
| Consumption | GJ | (tCO₂e) | (tCO₂e) | (tCO₂e) |
Scope 1: Direct energy use per primary source |
|
| 1,994 | 1,729.78 | 613.69 |
|
|
|
|
|
|
Stationary combustion |
|
| 936 | 952.60 | 383.28 |
Diesel (liters) | 159.00 | 6.01 | 0.42 | 0.89 | - |
Natural gas (KWh) | 4,062,595.60 | 16296.78 | 807 | 823.48 | 383.28 |
Propane (liters) | 479,266.20 | 12444.62 | 128 | 128.23 | - |
Mobile combustion |
|
| 911 | 671.30 | 154.91 |
Diesel (liters) | 143,365.20 | 5421.92 | 381 | 300.35 | 77.37 |
Petrol (liters) | 226,135.40 | 7703.07 | 529 | 370.95 | 77.54 |
LPG (liters) | 350.0 | 9.17 | 1 | - | - |
Fugitive Emissions: Refrigerants (kg) | 101.00 |
| 147 | 105.88 | 75.50 |
Scope 2: Indirect energy use per primary source |
|
| 3,877 | 6,574.92 | 696.46 |
|
|
|
|
|
|
Electricity (KWh) |
|
|
|
|
|
Grid (KWh) | 7,285,077.00 | 26,226.28 | 3,796 | 6,481.52 | 527.26 |
Renewable (KWh) | 11,012,898.40 | 39,646.43 | - | - | - |
Electric vehicles (KWh) | 23,460.00 | 84.46 | 6 | - | - |
District cooling (KWh) | 51,000.00 | 183.60 | 1 | - | - |
District heating (KWh) | 659,962.30 | 2,375.86 | 74 | 93.40 | 169.20 |
Energy (GJ) total |
| 110,398.20 |
|
|
|
Emission intensity (scope 1 + 2 emissions in tCO₂e/turnover in CHF million) |
|
| 5.46 | 7.26 | 1.38 |
|
|
|
|
|
|
Total Scope 1+2 (tCO₂e) |
|
| 5871 | 8,304.7 | 1,310.15 |
|
|
|
|
|
|
Scope 3: Other indirect emissions |
|
| 432,326 | 474,048 | 2,770.13 |
|
|
|
|
|
|
Business travel (all sites) |
|
| 7,372 | 5,676.00* | 1,882.17 |
Accommodation (nights) |
|
| 492 | 788.00 | - |
Air travel (pkm) |
|
| 6,363 | 3,587.00 | 1,882.17 |
Ground travel (km) |
|
| 373 | 1,160.00 | - |
Purchased goods and services |
|
| 202,852 | 205,009.00* | 18.15 |
Employee commuting and teleworking |
|
| 2,476 | 2,051.00 | 393.05 |
Waste generated in operations (tonnes) |
|
| 275 | 239.00 | 78.28 |
Fuel and energy related activities |
|
| 1,843 | 1,921.00 | 398.48 |
|
|
|
|
|
|
TOTAL Scope 1+2+3 (tCO₂e) |
|
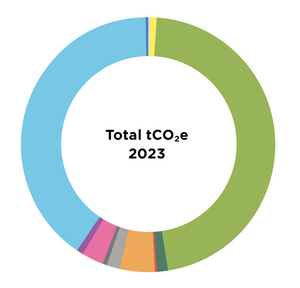
| 438,197 | 482,352.00* | 4,080.29 |
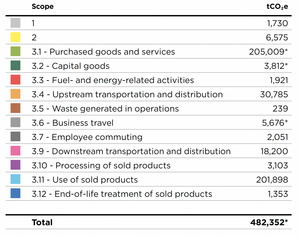
* 2022 Results have been restated in light of updated spend-based factors available. Therefore, 2022 results in this table do not match the numbers in the 2022 Tecan Annual Report. This restatement lowered Tecan's overall footprint by less than 5%.
Emissions are calculated in accordance with the Greenhouse Gas protocol and represented in tCO₂e. There are no biogenic CO₂ emissions. GWP (global warming potential) used is from the IPCC Report 2014 AR5, emissions factors used are mainly DEFRA BEIS 2023, IEA 2023 and CEDA 6 2023. The scope 2 data in the table above is market-based. The emissions consolidation approach used is operational control.
Calculations are based on activity so far as possible and otherwise on spend data. Spend data was either converted into activity data through estimations or directly calculated through spend-based emission factors. Any data gaps were filled through extrapolations based on averages per either number of full-time employees or square meters surface.
In 2022, scope 3(15) emissions were not reported as the amount, 1.64 tCO₂e, was deemed immaterial to Tecan's total global footprint. There are no scope 3(15) emissions in Tecan's 2023 footprint. In 2023, no steam was consumed or sold and no electricity, heating or cooling was sold.
Location-based approach
Scope | GHG Category | 2023 (tCO₂e) | 2022 (tCO₂e) |
Scope 2 |
| 7,178.16 | 7,178.12 |
Scope 2 | Electricity: Grid | 3,768.84 | 6,019.33 |
Scope 2 | Electricity: Renewable | 3,330.43 | 1,065.39 |
Scope 2 | Electricity: Electric Vehicles | 3.72 | - |
Scope 2 | Cooling | 1.07 | - |
Scope 2 | Heating | 74.10 | 93.40 |
Scope 3 |
|
|
|
Scope 3 | Fuel and energy related activities | 2,369.70 | 5,148.73 |
Water and waste data
| 2023 | 2022 | ||
| Amount | (tCO₂e) | Amount | (tCO₂e) |
Waste generated in operations (tons) |
|
|
|
|
Incineration | 79.40 | 48 | 103.09 | 54 |
Incineration hazardous | 54.06 | 49 | 8.82 | 22 |
Landfill | 316.40 | 160 | 263.08 | 120 |
Landfill hazardous | - | - | 16.33 | 3 |
Recycling | 383.56 | 6 | 289.25 | 6 |
Unspecified | - | - | 18.81 | 9 |
Unspecified hazardous | - | - | 2.43 | 6 |
Radioactive treatment | - | - | 0.29 | - |
Composting | 31.40 | 0 | - | - |
Water (m3) | 61,987.77 | 12 | 70,725.41 | 19 |
Waste is monitored and managed locally and waste data is collected from local site managers by Tecan’s Global Head of EHS (Environment, Health and Safety).
Total tCO₂e 2023
Total tCO₂e 2022

Calculated in accordance with the Greenhouse Gas Protocol
* 2022 results have been restated in light of updated spend-based factors available. Therefore, 2022 results in this table do not match the numbers in the 2022 Tecan Annual Report. This restatement lowered Tecan's overall footprint by less than 5%.
Social impact data
Employee Data
This data is headcount data unless indicated otherwise and reflects the period January 1, 2023 – December 31, 2023. Employees may have permanent or temporary contracts. Unless otherwise indicated, the data refers to all Tecan employees.
Certain Tecan employee benefits programs are specific to countries and / or influenced by local law. Tecan’s benefits always meet and may exceed legal requirements. Examples of benefits include life insurance, health care, disability and invalidity coverage, parental leave, other paid leave, retirement provision, stock ownership, global travel insurance, commuting subsidies, and company cars. Offer and acceptance of benefits is tracked internally but not reported, for reasons of business confidentiality. Analysis regarding the ratio of basic salary and remuneration of women to men is also carried out per country and reported where completed.
Gender diversity (# and %) of all employees globally, and by region
Region of operations | No. of female employees | Female | No. of male employees | Male | No. of not disclosed gender | Not disclosed gender em- | No. of all employees | All |
Asia Pacific | 703 | 19.68 | 446 | 12.48 | 2 | 0.06 | 1151 | 100 |
North America | 387 | 10.83 | 662 | 18.53 | 7 | 0.20 | 1056 | 100 |
Other Europe | 233 | 6.52 | 408 | 11.42 | 0 | 0.00 | 641 | 100 |
Switzerland | 219 | 6.13 | 506 | 14.16 | 0 | 0.00 | 725 | 100 |
Total global operations | 1542 | 43.16 | 2022 | 56.59 | 9 | 0.25 | 3573 | 100 |
Gender diversity (# and %) of all employees globally by contract type
Contract type | No. of female employees | Female | No. of male employees | Male | No. of not disclosed gender | Not disclosed gender em- | No. of all employees | All employees (%) |
Indefinite/permanent employees | 1526 | 42.71 | 2000 | 55.98 | 8 | 0.22 | 3534 | 98.91 |
Fixed-term/temporary employees | 16 | 0.45 | 22 | 0.62 | 1 | 0.03 | 39 | 1.09 |
Full-time employees | 1390 | 38.90 | 1916 | 53.62 | 9 | 0.25 | 3315 | 92.78 |
Part-time employees | 152 | 4.25 | 106 | 2.97 | 0 | 0.00 | 258 | 7.22 |
Non-guaranteed hours employees (casual workers, on-call employees, zero-hours contracts) | 0 | 0 |
| 0 | 0 | 0 | 0 | 0 |
Number and % of employee contract types by region
Contract type | No. of | % of | No. of | % of | No. of | % of | No. of | % of |
Indefinite/permanent employees | 1142 | 99.22 | 1055 | 99.91 | 630 | 98.28 | 707 | 97.52 |
Fixed-term/temporary employees | 9 | 0.78 | 1 | 0.09 | 11 | 1.72 | 18 | 2.48 |
Full-time employees | 1151 | 100 | 1052 | 99.62 | 559 | 87.21 | 553 | 76.28 |
Part-time employees | 0 | 0 | 4 | 0.38 | 82 | 12.79 | 172 | 23.72 |
Non-guaranteed hours employees (casual workers, on-call employees, zero-hours contracts) | 0 | 0 | 0 | 0 | 0 | 0 | 0 | 0 |
The number of temporary employees in North America is lower in 2023 than in 2022 because in 2022 this figure included some individuals who were contractors. In 2023, these individuals are counted as contractors.
The majority of employee data is maintained within the SAP system, facilitating direct querying. However, one entity was not yet hosting their data on SAP in 2023, therefore required employee data was directly requested from local HR. Subsequently, this dataset was aligned and merged with the SAP dataset to form the source data used here.
Number of non-employees by contract type and percentage share of total workforce
Contract type Headcount | No. of workers on each | Percentage (%) of workers within total workforce on each contract type |
Contractors (independent, self-employed) | 610 | 14.58 |
Agency workers (e.g. labor agency, recruitment agency workers) | ||
Franchisee workers | 0 | NA |
Third party on site workers (e.g. subcontracted service workers, third-party workers) | 0 | NA |
Total number of employees in global operations | 3573 | 85.42 |
Total workforce (employee + non-employee workers) | 4183 | 100 |
Non-Employees / Contingent Contractors are: External Consultants, External Contractors, Temp by Agency (short term temporary contracts) and Board Members. Tecan engages the most common types of non-employee workers indirectly through employment agencies and directly with contractors. Workers who are not employees carry out tasks to support Tecan’s ordinary business activities.
Gender diversity (%) of the company’s governance bodies (Extended Management Board [EMB] and Board of Directors)
Age diversity (%) of the company’s governance bodies (Extended Management Board [EMB] and Board of Directors)
Gender diversity (%) of all employees globally by employee category
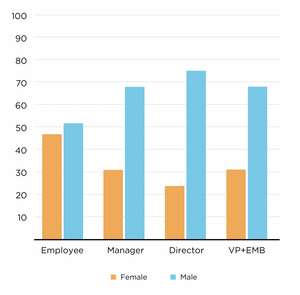
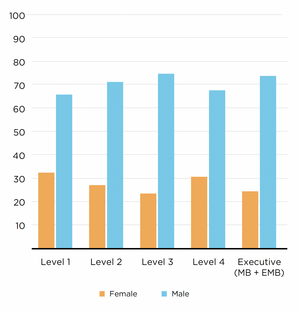
Gender diversity (%) of all employees globally by management level
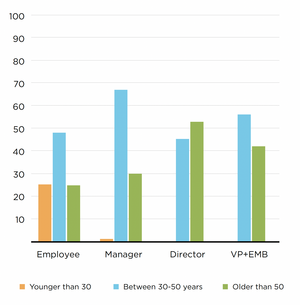
Age diversity (%) of all employees globally by employee category
New employee hire rate (%) across global company by gender
Gender group | New hires across global operations | New hire rate |
Female employees | 208 | 5.82 |
Male employees | 249 | 6.97 |
Undeclared/Unknown | 10 | 0.28 |
Non-binary employees | 0 | 0.00 |
Total new employees globally | 467 | 13.07 |
New employee hire rate (%) across global company by age group
Age group | New hires across global operations | New hire rate |
Employees under 30 years old | 175 | 4.90 |
Employees 30-50 years old | 210 | 5.88 |
Employees over 50 years old | 80 | 2.24 |
Unknown age | 2 | 0.06 |
Total new employees globally | 467 | 13.07 |
New employee hire rate (%) across global company by region
Region of operations | New hires across global operations | New hire rate |
Asia Pacific | 147 | 4.11 |
North America | 147 | 4.11 |
Other Europe | 93 | 2.60 |
Switzerland | 80 | 2.24 |
Total new employees globally | 467 | 13.07 |
Turnover rates, voluntary and involuntary, of global company by gender
Gender group | No. of voluntary turnover | Voluntary | No. of involuntary turnover | Involuntary | No. of all turnover | Total turnover rate (%) |
Female employees | 126 | 3.53 | 56 | 1.57 | 199 | 5.57 |
Male employees | 138 | 3.86 | 74 | 2.07 | 230 | 6.44 |
Undeclared/Unknown | 3 | 0.08 | 1 | 0.03 | 4 | 0.11 |
Non-binary employees | 0 | 0.00 | 0 | 0.00 | 0 | 0.00 |
Total global employees | 267 | 7.47 | 131 | 3.67 | 433 | 12.12 |
Turnover rates, voluntary and involuntary, of global company by age group
Age group | No. of voluntary turnover | Voluntary | No. of involuntary turnover | Involuntary | No. of all turnover | Total turnover rate (%) |
Employees under 30 years old | 84 | 2.35 | 42 | 1.18 | 129 | 3.61 |
Employees 30-50 years old | 149 | 4.17 | 61 | 1.71 | 214 | 5.99 |
Employees over 50 years old | 32 | 0.90 | 28 | 0.78 | 88 | 2.46 |
Unknown age | 2 | 0.06 | 0 | 0.00 | 2 | 0.06 |
Total global employees | 267 | 7.47 | 131 | 3.67 | 433 | 12.12 |
Turnover rates, voluntary and involuntary, of global company by region
Region of operations | No. of voluntary turnover | Voluntary | No. of involuntary turnover | Involuntary | No. of all turnover | Total turnover rate (%) |
Asia Pacific | 108 | 3.02 | 27 | 0.76 | 148 | 4.14 |
North America | 59 | 1.65 | 43 | 1.20 | 111 | 3.11 |
Other Europe | 53 | 1.48 | 33 | 0.92 | 90 | 2.52 |
Switzerland | 47 | 1.32 | 28 | 0.78 | 84 | 2.35 |
Total global employees | 267 | 7.47 | 131 | 3.67 | 433 | 12.12 |
Percentage of all employees covered by collective bargaining agreements
| % of employees covered by collective bargaining agreements |
Total global operations | 10.80 |
Average number of hours of training provided per employee (FTE basis), by employee category
Employee category | Average hours of training provided per employee |
Research and development management | 46.47 |
Research and development non-management | 44.57 |
Manufacturing and logistics management | 54.18 |
Manufacturing and logistics non-management | 53.10 |
Sales and marketing management | 41.72 |
Sales and marketing non-management | 40.63 |
Customer service management | 48.89 |
Customer service non-management | 43.85 |
General administration management | 48.48 |
General administration non-management | 44.15 |
Unable to assign | 45.34 |
For additional information see the Social Impact section of the report. Included in the Learning and Development section of this report is information about the type and scope of programs implemented and assistance provided to upgrade employee skills. Transition assistance programs provided to facilitate continued employability and the management of career endings resulting from retirement or termination of employment are included in the general description of the other learning and development offerings provided. Line Managers are advised to once a year at minimum have a conversation with their team members about each member’s personal development plan. The management of career endings is handled case-by-case depending on local legal requirements and the circumstances.
Percentage of all employees (EE) who received a regular performance and career development review, also by gender
Gender group | % of employees who recieved a performance review | Number of employees who recieved a performance review | Total number of EE |
Female employees | 34.82 | 537 | 1542 |
Male employees | 58.16 | 1176 | 2022 |
Undeclared/Unknown | 0.00 | 0 | 9 |
Total global employees | 47.94 | 1713 | 3573 |
Percentage of all employees (EE) who received a regular performance and career development review, by employee category
Employee category | % of employees who recieved a performance review | Number of employees who recieved a performance review | Total number of EE |
Research and development management | 85.27 | 191 | 224 |
Research and development non-management | 70.53 | 146 | 207 |
Manufacturing and logistics management | 55.14 | 118 | 214 |
Manufacturing and logistics non-management | 21.63 | 374 | 1729 |
Sales and marketing management | 89.58 | 129 | 144 |
Sales and marketing non-management | 74.60 | 185 | 248 |
Customer service management | 97.37 | 74 | 76 |
Customer service non-management | 81.88 | 244 | 298 |
General administration management | 74.46 | 172 | 231 |
General administration non-management | 39.60 | 80 | 202 |
Total global employees | 47.94 | 1713 | 3573 |
Tecan’s employee performance review process is described in the Social Impact section of the report, and is offered to all (100%) employees.
Health and Safety
Tecan’s Health and Safety program is set out in the section of this report. Below is the data related to the Health and Safety program.
| Tecan’s employees covered by Tecan’s occupational health and safety management system, which is described in the Health and Safety chapter of this report. Workers who are not employees but whose workplace is controlled by Tecan also benefit from this system. (GRI 4053-8ai) |
| 3573 (100%) |
| Employees working at locations where the occupational health and safety management system has been internally audited. At these sites, workers who are not employees but whose workplace is controlled by Tecan also benefit from this. (GRI 403-8aii) |
| 717 (20.1%) |
| Globally, Tecan has 650 workers who are not employees. For 2023, Tecan does not report which locations these workers are based at, and so does not report what % of these workers are at sites where the occupational health and safety management system has been internally audited. (GRI 403-8b) |
|
|
GRI 403-9ai – 9bv follow: |
|
| |
| For all employees: The number and rate of fatalities as a result of work-related injury: |
| 0, 0 |
| For all employees: The number and rate of high-consequence work-related injuries (excluding fatalities): |
| 0, 0 |
| For all employees: The number and rate of recordable work-related injuries: |
| 20, 3.04 (LTIR 1.83) |
| For all employees: The main types of work-related injury: |
| Cut, back pain |
| For all employees: The number of hours worked: |
| 6,568,675 |
| For all workers who are not employees but whose work and/or workplace is controlled by the organization: The number and rate of fatalities as a result of work-related injury: |
| 0, 0 |
| For all workers who are not employees but whose work and/or workplace is controlled by the organization: The number and rate of high-consequence work-related injuries (excluding fatalities): |
| 0, 0 |
| For all workers who are not employees but whose work and/or workplace is controlled by the organization: The number and rate of recordable work-related injuries: |
| 0, 0 |
| For all workers who are not employees but whose work and/or workplace is controlled by the organization: The main types of work-related injury: |
| No injuries reported |
| For all workers who are not employees but whose work and/or workplace is controlled by the organization: The number of hours worked: |
| This data is not available for 2023. |
| Rates have been calculated based on 1,000,000 hours worked (GRI 403-9e) |
|
|
| No workers have been excluded from this disclosure. (GRI 403-9f) |
|
|
GRI 403-10ai – 10bi follow: |
|
| |
| For all employees: The number of fatalities as a result of work-related ill health: |
| 0 |
| For all employees: The number of cases of recordable work-related ill health: |
| 1 |
| For all employees: The main types of work-related ill health: |
| Musculoskeletal disorder |
| For all workers who are not employees but whose work and/or workplace is controlled by the organization: The number of fatalities as a result of work-related ill health: |
| 0 |
| For all workers who are not employees but whose work and/or workplace is controlled by the organization: The number of cases of recordable work-related ill health: |
| 0 |
| For all workers who are not employees but whose work and/or workplace is controlled by the organization: The main types of work-related ill health: |
| No ill health reported |
GRI 403-10ci – 10d follow: |
|
| |
| The work-related hazards that pose a risk of ill health, including: how these hazards have been determined: Insufficient ergonomics or inadequate workplace design was identified and recorded as a risk through the Group-wide risk assessment. Mitigation of the risk is being achieved by ensuring proper infrastructure is in place. In the reporting year, one case of ill health has been attributed to this work-related hazard. No workers are excluded from this disclosure. |
|
|
Governance Data
Responsible Sourcing
Tecan’s Responsible Sourcing program tracks the results of program activities at every step of the process set out in the Responsible Sourcing section of this report. The metrics shown below in bold are included in the data shared in this report:
Percentage and number of suppliers annually that:
- Have their sustainability performance assessed during the supplier qualification process
- Sign Tecan’s Supplier Code of Conduct
- Complete an EcoVadis assessment
- Implement a corrective action plan
- Were inspected or visited
- Were further assessed via Tecan’s responsible sourcing escalation process
- Tecan terminates a relationship with because of their poor sustainability practices
Screening is carried out simultaneously for impacts relating to Environment, Labor and Human Rights, Ethics, and Sustainable Procurement. Tecan's Responsible Sourcing program was implemented during 2023. Suppliers working with Tecan before September, 2023, are being requalified in the process described in the Responsible Sourcing section of this report. Internal controls and program management revealed that after September, 2023, nine suppliers were qualified outside of the new supplier qualification process. This is being addressed and further steps taken to ensure the process is fully adhered to globally in future. Supplier feedback regarding the new process resulted in further clarification of the information being requested during supplier qualification and requalification. In Tecan’s 2023 annual letter to suppliers, a reminder of the importance of the Responsible Sourcing process was included. No (0) suppliers completed a corrective action plan in 2023, and no (0) supplier relationships were terminated because of poor supplier sustainability practices.
Percentage of new suppliers that were screened using environmental criteria |
| 43% (40) new suppliers were screened in total in 2023; since September, 2023, 96% (22) new suppliers were screened. |
Number of suppliers assessed for environmental impacts |
| 2367 suppliers screened on EcoVadis IQ platform for environmental impacts |
Number of suppliers identified as having significant actual and potential negative environmental impacts |
| 162 suppliers presented potentially high environmental risk in EcoVadis IQ initial screening process. |
Significant actual and potential negative environmental impacts identified in the supply chain |
| Top 3 environmental potential risks in our supply chain identified via EcoVadis IQ risk screening: 1) Materials, Chemicals & Waste, 2) Energy consumption & GHGs and 3) Water |
Percentage of suppliers identified as having significant actual and potential negative environmental impacts with which improvements were agreed upon as a result of assessment |
| Of 162 suppliers in the potential high risk category 141 (or 87%) have now completed the assessment step of signing Tecan's |
Percentage of suppliers identified as having significant actual and potential negative environmental impacts with which relationships were terminated as a result of assessment, and why |
| 0 |
Operations and suppliers considered to have significant risk for incidents of: child labor |
| 39 suppliers presented potentially high labor & human rights risk in EcoVadis risk screening |
Operations and suppliers considered to have significant risk for incidents of: young workers exposed to hazardous work |
| 39 suppliers presented potentially high labor & human rights risk in EcoVadis risk screening |
Operations and suppliers considered to have significant risk for incidents of child labor either in terms of: type of operation (such as manufacturing plant) and supplier |
| In the EcoVadis IQ screening risk process the type of operation and location is taken into account. |
Operations and suppliers considered to have significant risk for incidents of child labor either in terms of: countries or geographic areas with operations and suppliers considered at risk |
| In the EcoVadis IQ screening risk process the type of operation and location is taken into account. |
Measures taken by the organization in the reporting period intended to contribute to the effective abolition of child labor |
| 92% of the 39 suppliers presenting potentially high labor and human rights risk have now signed Tecan's SCoC as an early step in the Responsible Sourcing process. Additional measures include the establishment of Responsible Sourcing team, implementation of qualification criteria, currently requalifying suppliers. |
Follow Tecan